|
Williams - a Workload Automation Administrator  “As an Administrator, I need to check the available load of workstations and also how many jobs or job streams are running on a particular workstation, on a particular day or period of time”. Solution:  Reports help in many business-related activities. With just a few clicks and the required filtered criteria, they can help with tuning the workload on the workstations, extracting detailed information about the plan, and detecting jobs with exceptions. Tuning the workload on the workstations can be done based on generated Statistical Reports according to business requirement. About Statistical Reports:  The Statistics Summary report shows summarized statistics, such as total or maximum values based on the filtered criteria. There are two types of Statistical Reports: 1. WWS: Workstation Workload Summary Report
2. WWR: Workstation Workload Runtimes Report
These reports can run on both Distributed and Zos Engines. Creating Statistical Reports: To create a task to run a statistical report (WWR/WWS), perform the following steps: 1. From the header (top Navbar), Click Monitoring and Reporting. A dropdown menu is generated. In the Reporting section, click Manage Predefined Reports and then click Create. For example, click Monitoring and Reporting > Reporting >> Manage Predefined Reports > Create. New Report information. Create Panel has Task Information Tab, Report Header, Filter Criteria, Report output Content tab 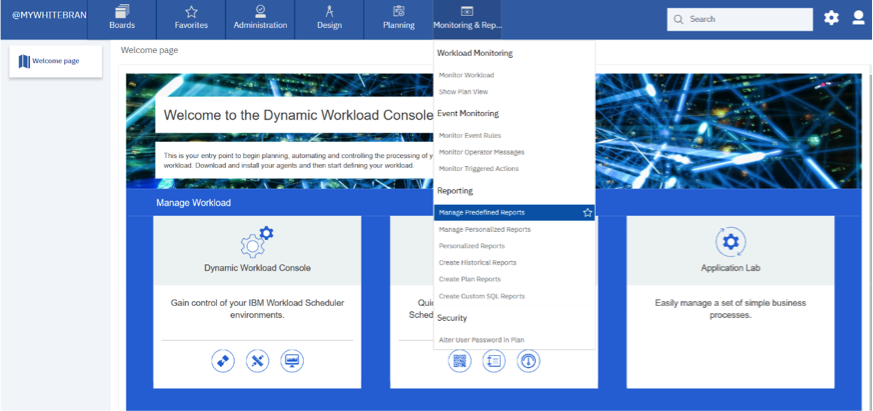 Figure 1 shows Navigation to Manage Predefined Reports 2. In the Task Information tab, select Report Type as Workstation Workload Summary Report (WWR) or Workstation Workload Runtimes Report (WWR). Define the type of scheduler engine (Distributed or Zos) where you want to run the task. 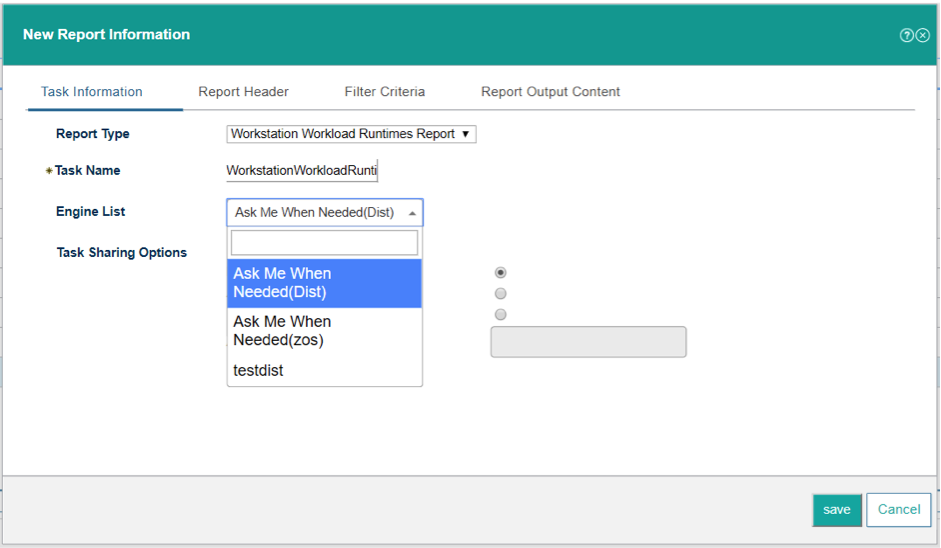 Figure 2 shows Task Information Tab contents 3. In the Report Header panel, choose the name and the format of the output of the report, and click Save to complete the task creation using all the default values. If you are editing an existing task properties, click Save to keep your changes and open the next tab, if needed. We have different filter criteria for WWR and WWS to generate reports. WWS Filter criteria: 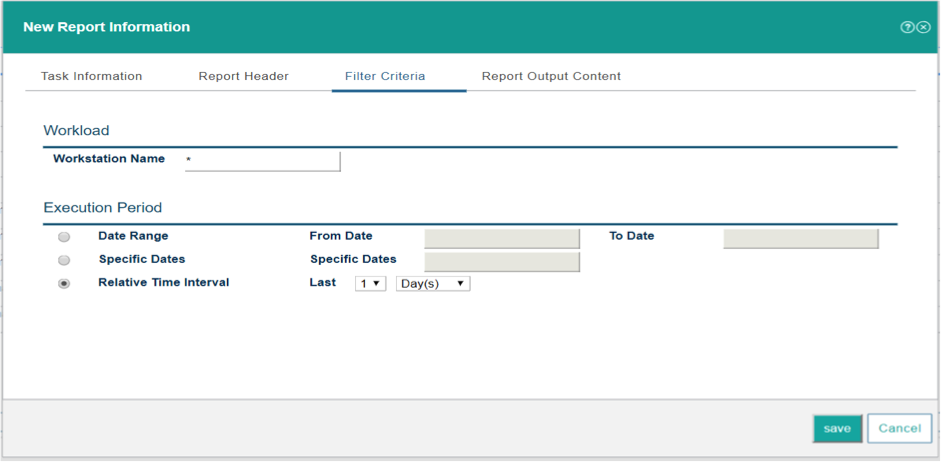 Figure 3 shows Filter Criteria contents for WWS We can generate WWS report based on the specific workstation, or report for all the workstations. WWR Filter criteria 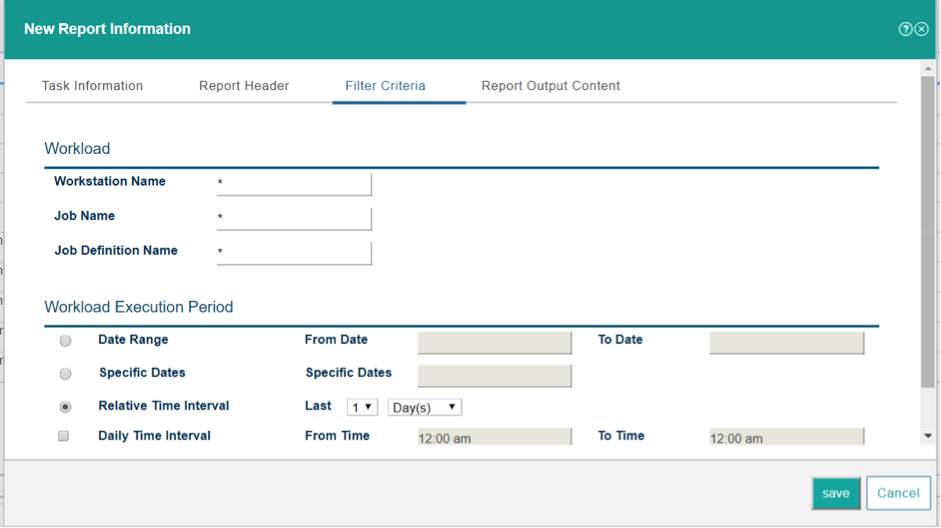 Figure 4 shows Filter Criteria contents for WWR We can generate WWR report based on the specific workstation or Job name or Job definition name or with combinations or can generate report for all the available workstation or Job name or Job definition name. 4. Reports can be generated in multiple formats like HTML, CSV with Charts View or Table view with more available options required to be there on the generated report. Report Output Content panel: 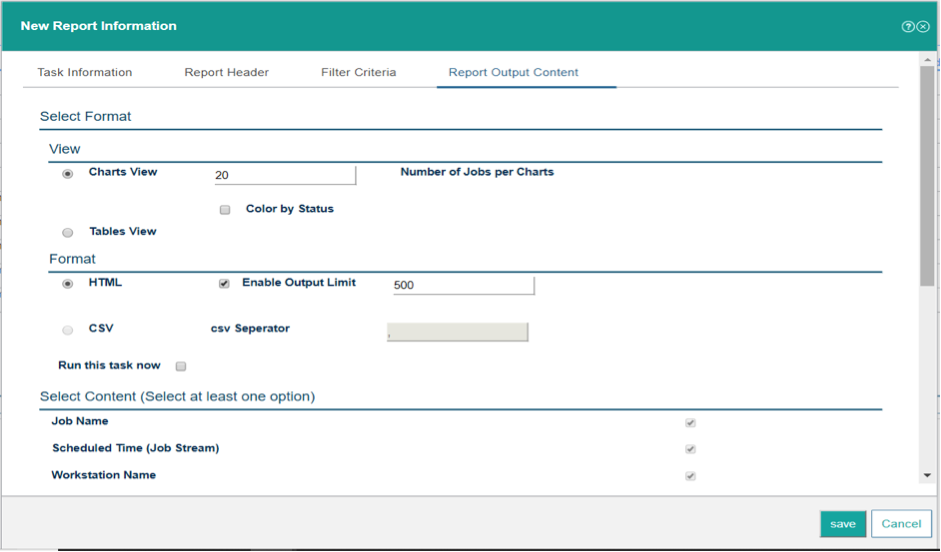 Figure 5 shows Report Output Content panel where we can select format and view for reports 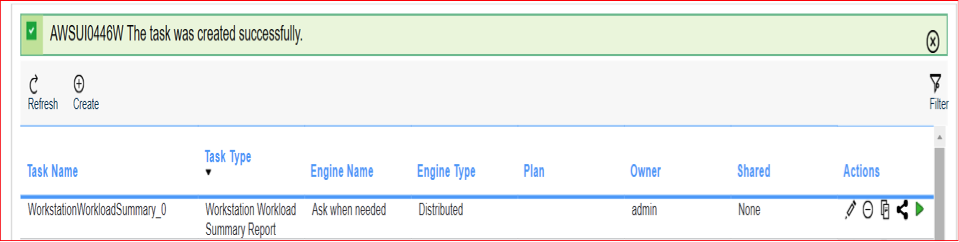 Figure 6 shows saved WWS Task on Manage Predefined page with multiple actions that can be performed 5. Run the Report When you click on the green arrow to run the report by providing engine connection, you would get WWS report (html format) as shown below: 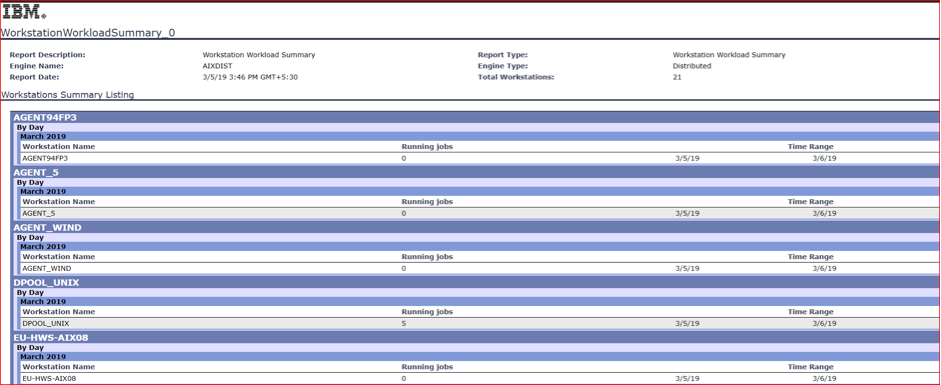 Figure 7 shows WWS Generated Report in HTML format 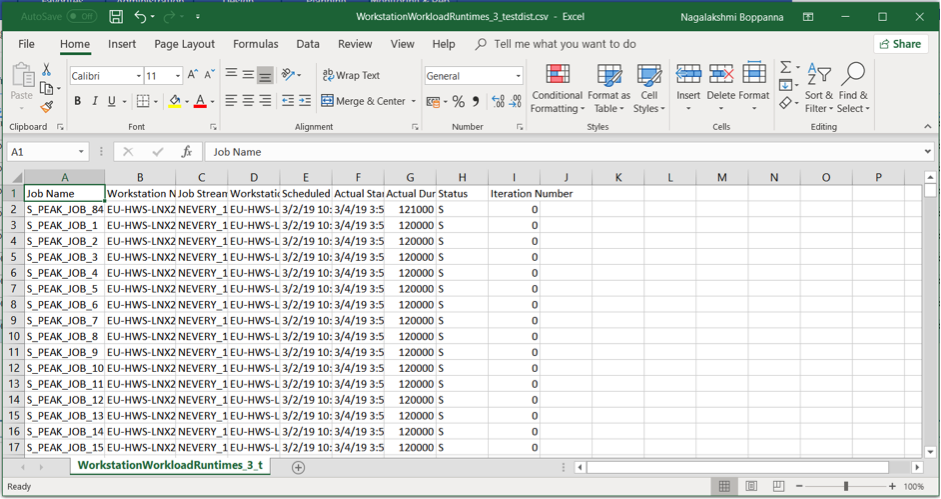 Figure 8 shows WWR Generated Report in Tables View and CSV format 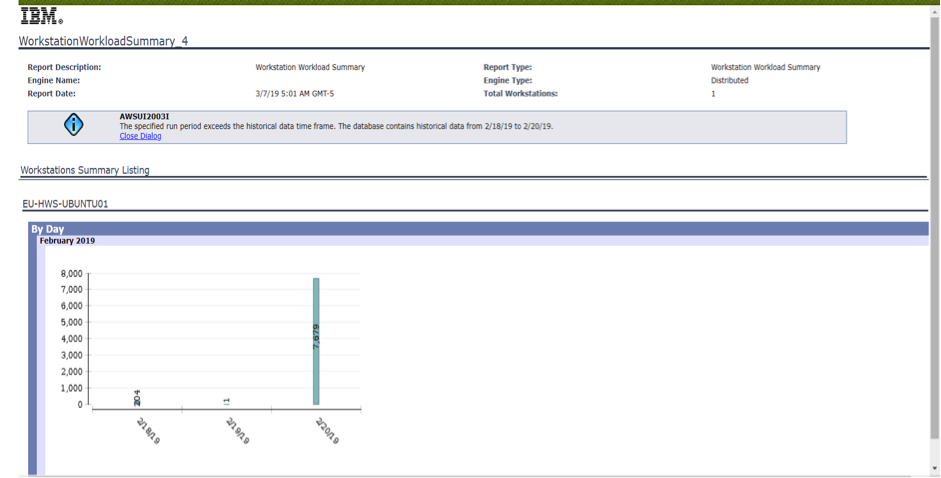 Figure 9 shows WWR Generated Report Chart View and HTML format Users can get information like:  Details of jobs ran on a day or on a selected period on a selected workstation.  Data about load on each workstation.  Job duration time based on the filter criteria which helps for capacity planning adjustments and much more based on the filter criteria given. For any questions about this blog, you can contact:  Nagalakshmi B, nagalakshmi.b@hcl.com Technical Lead at HCL She is currently designated as Technical lead. Working on Automation testing in HCL PnP Bangalore. Nagalakshmi started her career as lecturer in a University, teaching Graduate students and moved as a fresher in Manual testing in 2011. She received best performance award in automation in the beginning of her career itself. Her knowledge on automation tools was not limited to one, but spread on multiple tools like Bad boy, selenium, Coded UI, Ride etc. She has an interest in drawing, and loves to explore on technical articles.  Bhoodev Kumar, bhoodev.k@hcl.com
Software Developer at HCL He received a degree in Computer Science & Engineering from National Institute of technology (NIT) Hamirpur, India. Bhoodev is a Software Developer in Products and Platform Division in HCL Technologies Ltd, Bangalore. Formerly, he worked in Manipal Global Education Services as a Developer and Infosys as a Consultant. He is very much passionate and persistent about exploring the new software technologies, programming and web development skills. In addition to having strong skills in front-end development, he loves cooking, listening to music, and traveling to new places.
0 Comments
Your comment will be posted after it is approved.
Leave a Reply. |
Archives
August 2023
Categories
All
|
 RSS Feed