 “Speed defines success in today’s digital economy. With customers expecting flawless digital experiences and competition hovering just a click away, companies turn to cloud-native technologies like microservices, containers and Kubernetes to accelerate innovation, build applications faster and improve performance. However, moving to cloud-native technologies and distributed architectures introduces new challenges around speed, scale, and complexity of data challenges that traditional monitoring solutions simply weren’t designed to handle. This is where observability comes in.” [1] The Observability is the evolution of monitoring into a process that offers insight into digital business applications, speeds innovation and enhances customer experience, basically it is an emerging set of practices, platforms, and tools that goes beyond monitoring to provide insight into the internal state of systems by analyzing external outputs. Wikipedia describes the mathematical concept of observability as “A measure of how well internal states of a system can be inferred from knowledge of its external outputs.” [2] This description is also true when it comes to building applications. State refers to data in your application at different stages, and external outputs refer to traces or logs. For decades, Monitoring has been a core function of IT, but old approaches have become inadequate for a variety of reasons like cloud deployments, agile development methodology, continuous deployments, and new DevOps practices among them. Traditionally IT teams have relied on APM tools to monitor and troubleshoot applications (telemetry, KPIs, dashboards), but APM tools are less effective to monitor cloud native applications (more widely distributed on multiple systems, with faster DevOps cycles). There is need for higher-quality telemetry that can be used to create a high-fidelity, context-rich, fully correlated record of every application user request or transaction, that is Observability. Observability platforms discover and collect performance telemetry continuously by integrating with existing instrumentation built into application and infrastructure components, and by providing tools to add instrumentation to these components. “At the heart of the observability concept is a very basic premise: quickly learn what happens within your IT to avoid extended outages. And in the unfortunate event of an outage, you need to ensure that you can get to the root cause of it fast. Outages are measured by Mean Time To Resolution (MTTR) and it is the goal of the observability concept to drive the MTTR value to as close to zero as possible.” [3] This means that: Observability is a critical business investment, especially when seconds of downtime can cost millions of dollars. [1] SPLUNK: 12 Immutable Rules for Observability [2] Wikipedia: https://en.wikipedia.org/wiki/Observability [3] GIGAOM: GigaOm Radar for Cloud Observability Downstream of all this we can say that Monitoring is about understanding if things are working properly in a service-centric manner while Observability is about enabling complete end-to-end visibility into your applications, systems, APIs, microservices, network, infrastructure, and more. The most effective approach to enable observability for distributed products is to use emerging open standards for data collection, such as OpenTelemetry and OpenMetrics, that are supported by multiple tools. Observability focuses on four main telemetry data:
While Logs and Metrics have been measured by IT professionals for decades, Traces are a fairly new concept that emerged as modern applications increasingly were built using distributed microservices. A service request is no longer completed by one service but rather by a composition of microservices, and as such there is an imperative to track or trace the service request from start to finish. Same goes for events, modern architecture being elastic and components ephemeral, containers are started, stopped, fixes are applied, and infrastructure are added on demand, all those actions are in fact events that have also to be tracked and observed. Observability is not always about introducing new tools, but about consolidating the telemetry data, properly instrumenting systems to get the appropriate telemetry, creating actionable insights, and avoiding extended outages. Most importantly it must provide sophisticated alerting, due to elasticity of modern workloads, the thresholds hast to be dynamic, the alerts in place must adapt to ongoing scenarios and identify anomalies. Comprehensive observability is core to future proofing IT infrastructure, therefore HCL Workload Automation Team has worked and continues to work to allow its customers to fully observe HWA product by integrating with a third-party products. The first product, in a long series, with which a 360 ° integration has been made is Splunk, one of the most used tools by companies. By observing HWA, the team will have visibility on the golden signals, from HWA’s point of view the golden signals could be: Latency: The time it takes to perform a job request Traffic: A measure of how much demand is being placed on HWA system, measured in a high-level system-specific metric Errors: The rate of requests / Jobs that fail, explicitly (e.g., HTTP 500s), implicitly Saturation: How "full" HWA service is At this point let's focus on why we chose Splunk as the first integration and how HWA integration has been made with Splunk. Splunk is one of the market leaders in Observability space, primarily used as a log aggregator letting users search insightful data from huge volumes of indexed logs. Splunk performs capturing, indexing, and correlating the real-time data in a searchable container from which it can produce user friendly dashboards, and aggregated data visualizations. Splunk Enterprise is capable of ingesting data from applications like HCL Workload Automation (HWA) and the data can then be filtered and ingested to indexers which in turn converts it to individual events, ready to be queried, filtered and display in dashboards. Suppose you are an HWA Administrator, and you have to find out what’s went wrong with a particular event where thousands of jobs, job-streams, workstations etc., that you are working with. Take a look at the machine-generated data to get an idea of how it looks like. It would take hours/days to find out what’s wrong with your workloads. Now, this is where Observability tools like Splunk comes into the picture. It will do all the hefty tasks for you, i.e., processing of the whole data, which was generated by your system, and after obtaining the relevant data, it will be a lot easier to locate the problems via dashboards and drilldown to insights of the data. As mentioned in the previous section of the blog, HWA Observability for Splunk is the first product, and HWA integration has been made with Splunk. This app comes with predefined dashboards which can be deployed on Splunk Enterprise. In these dashboards, you can view the whole status of your workloads at a glance for the engine you have configured. The overview dashboard provides a single, consolidated view for monitoring the activities, infrastructure, jobs, job-streams, workstations status etc. And you can drilldown in each dashboard for more complete data insights. 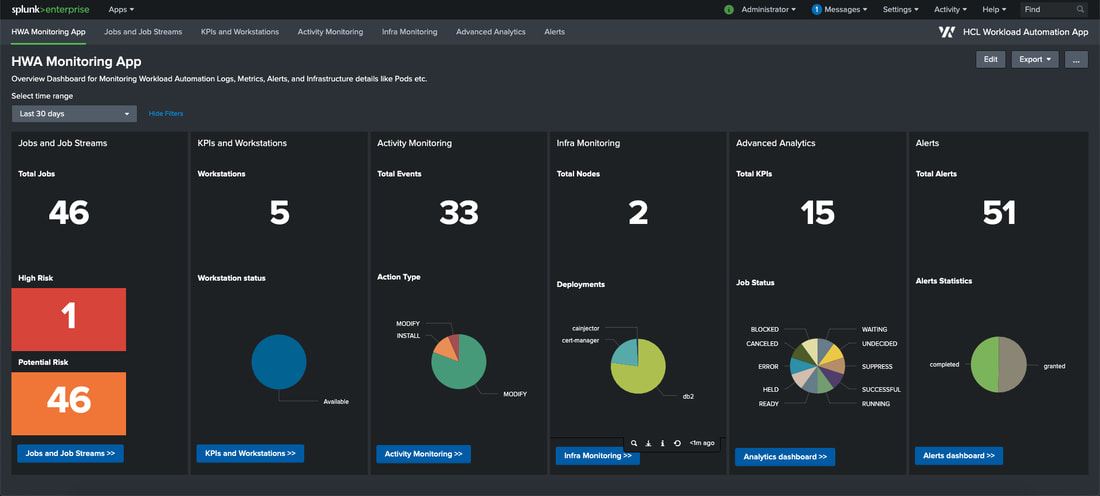 Dashboard: Jobs and Job-Streams Description: Jobs and Job-Streams dashboard display the status and insights of HWA Jobs, Critical jobs, and Job Streams. Input Source: HWA Deployment events sidecar container and HWA server Logs 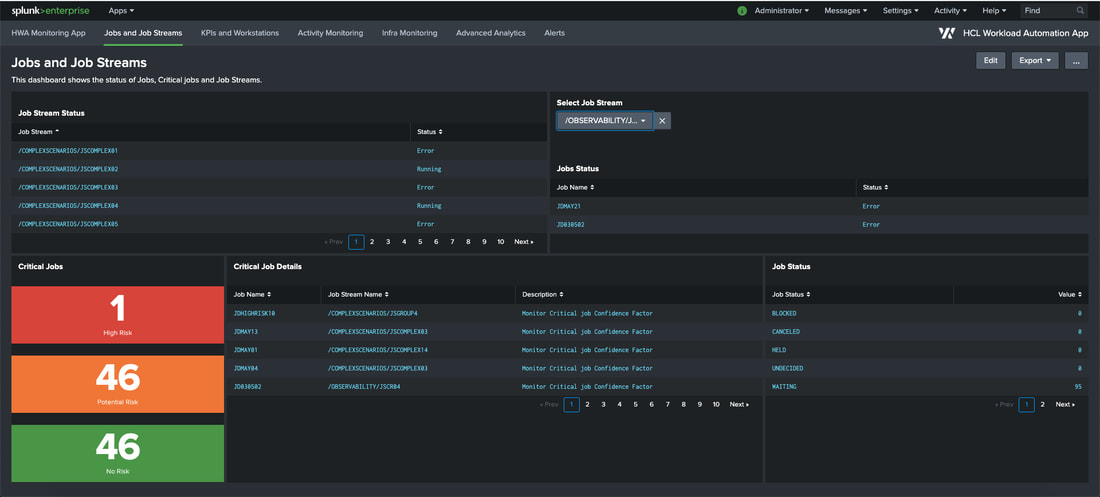 Dashboard: KPIs and Workstations Description: KPIs and Workstations dashboard display the HWA KPIs information and allow drilldown to see the timeseries data in visual representation for defined KPIs. Input Source: API exposed by HWA Server 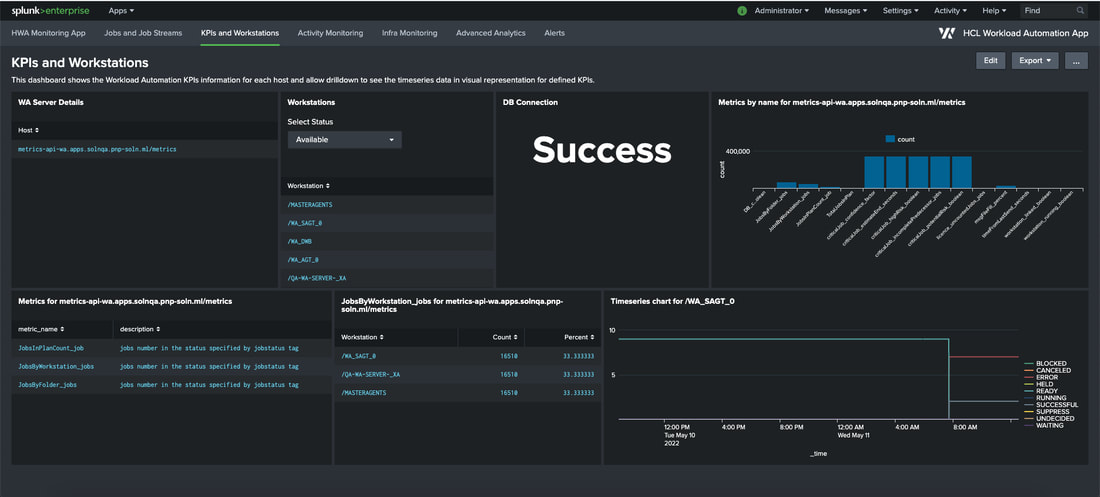 Dashboard: Activity Monitoring Description: Activity Monitoring dashboard display workstations and audit information such as activities performed by users. Input Source: HWA sidecar containers; DB auditing and Plan auditing 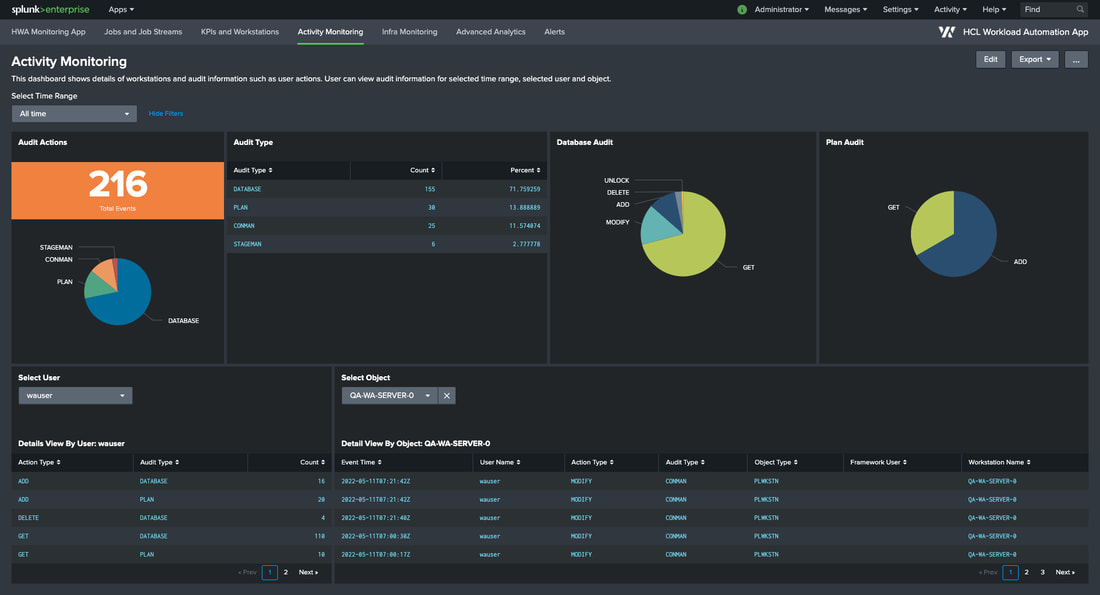 Dashboard: Infra Monitoring Description: Infra Monitoring dashboard display overview of infrastructure details of HWA deployed on Kubernetes environment. Input Source: Infrastructure Logs exposed by OpenShift cluster where HWA is deployed 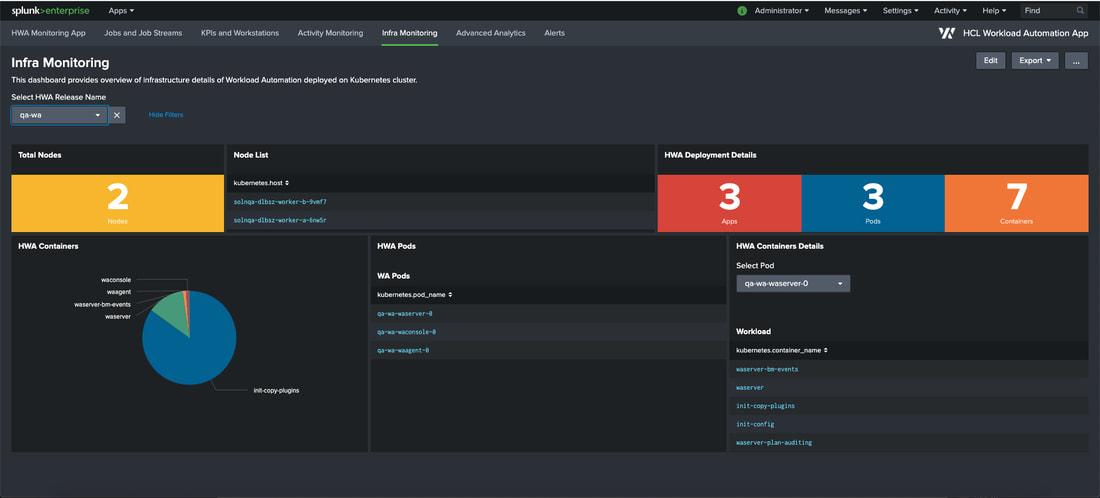 Dashboard: Alerts Dashboard Description: HWA Splunk Application comes with predefined alerts configured as an example. You can navigate to alerts page and easily create new alerts, enable/disable those alerts when needed. The statistical reports and graphical visualizations of the alerts created for HWA application can be viewed in Alerts Dashboard. Input Source: Alerts can be created from all the events data flowing from HWA; API exposed by HWA Server, HWA events sidecar containers, HWA server logs and infrastructure logs. 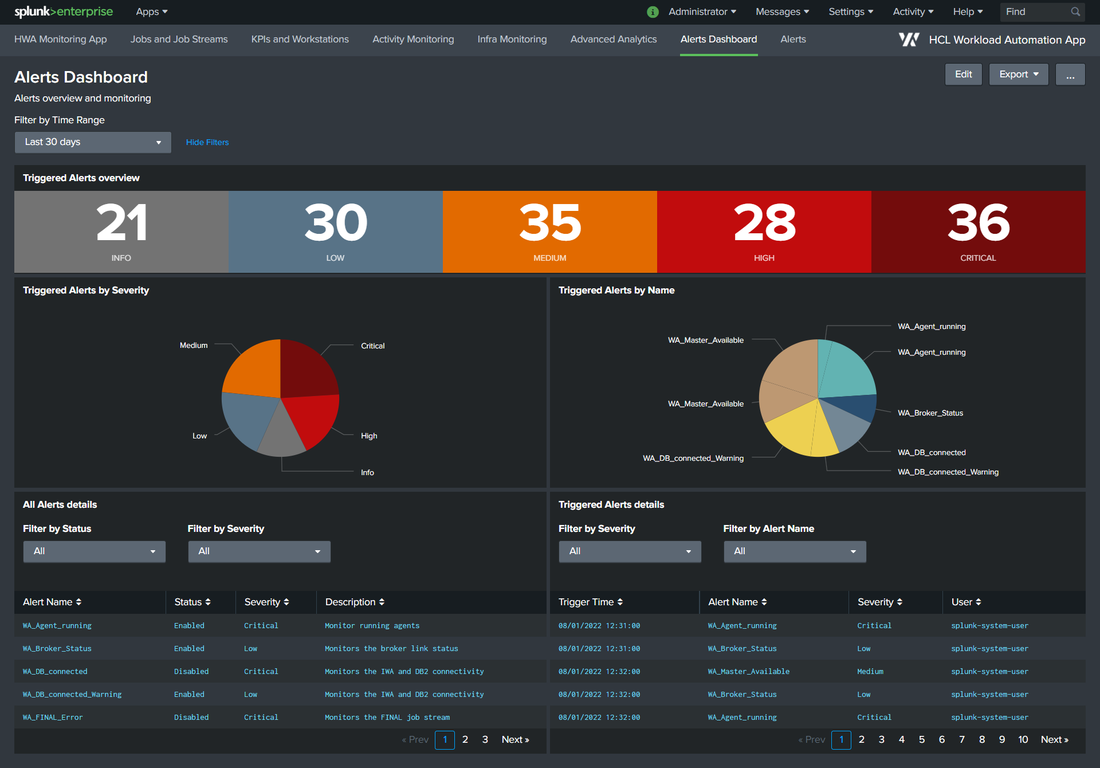 Conclusion Although there are many Observability tools available in the market and some of the top software tools will be supported by the HCL Workload Automation in the future, HWA Observability App for Splunk is the first product, and HWA integration has been made with Splunk and built some of the useful dashboards using predefined dashboards capability of Splunk. This app would be great to visualize KPIs, search and query data among large volumes of logs and visualize them in dashboards. Watch this demo to learn more as you plan for your HWA Observability strategy that cuts through all the blind spots and reduce your mean-time-to-resolution. Authors Bio
0 Comments
Your comment will be posted after it is approved.
Leave a Reply. |
Archives
August 2023
Categories
All
|




 RSS Feed