 Worried about how to summarize the stats of your historical jobs? Want to know the hassle-free solution for it? Then Let’s Get Started! If you are looking for statistics to detect success, error rates; minimum, maximum, and average duration; late and long duration statistics, then your choice could be “Job Run Statistics (JRS) Report”. Didn’t find a match for your need? Not an issue, we have the other report that will meet your requirements. Let’s take a look! To detect the jobs ended in error or were late, and those jobs which missed their deadline, long duration jobs, and rerun indicators for reruns, you can use “Job Run History (JRH) Report”. Sounds interesting right? Let’s go deeper into this. JRS is available in both graphic and table formats and JRH is available only in table format. You can choose either HTML or CSV as the output format whichever is more appropriate. In WA V9.5, the usage of the report is made much simpler with a new friendly UI, and you can even produce your reports in PDF format. In the modal, you could see that there are 4 sections for the report. The “Task information” and “Report Header” sections are quite a common detail for all the reports. Specific information for the reports is there in “Filter Criteria” and “Report Output Content” sections. Will first checkout the “Filter” section details for JRS. 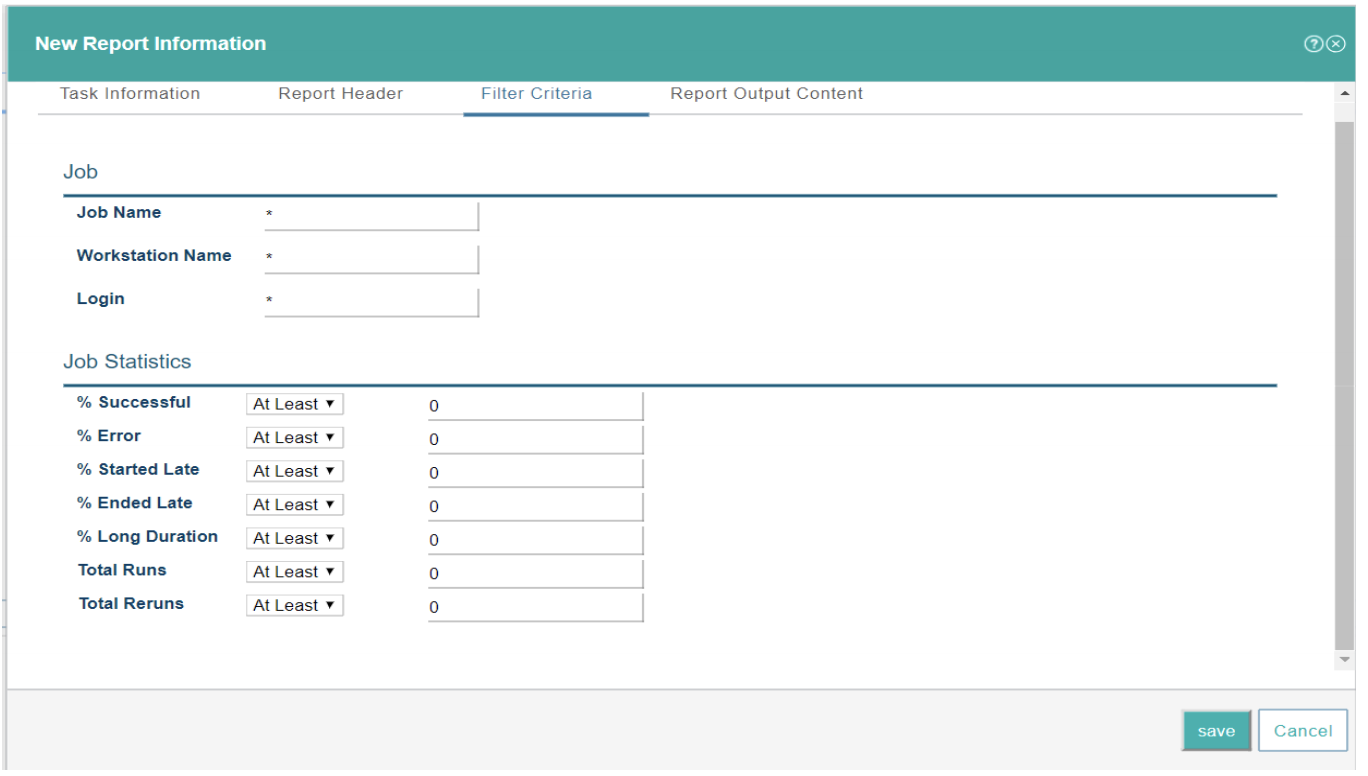 Figure 1: Filter criteria for JRS. Here is where you can find the solution for your need. User can get the statistics of the jobs based on the input you provide under the “Job Statistics” section. You can input the values ranging between 0-100 (not in decimal values) for the percentage of criteria (successful, error…) and select either “At least” or “At Most” option. Now let’s have a look at the filter criteria for JRH: 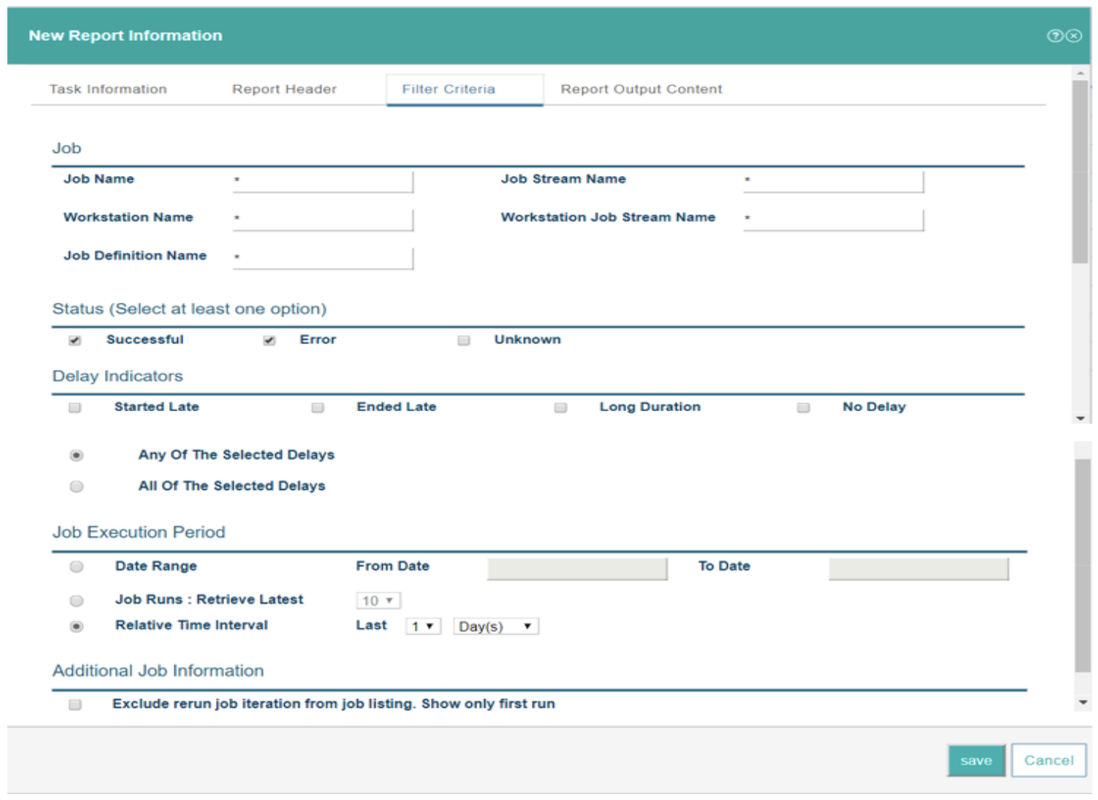 Figure 2: Filter criteria for JRH. The options in the above screenshot will enable you to filter out the data based on “Status”, “Delay Indicators”, “Job Execution Period” criteria. Seems like you almost got the gist of the report usage to analyse all your jobs. Now let’s check the “Report Output Content” section which will have the options to decide how your report should look like. In this section, you can choose the option for report view and format. You can also specify the “Enable Output Limit” in case of “HTML” format to limit your data for a short and more crisp report if required. You can also see that there is “Run this task now” option which is very handy to run the report directly once you save the report, reducing couple of more clicks to run after you save the report. 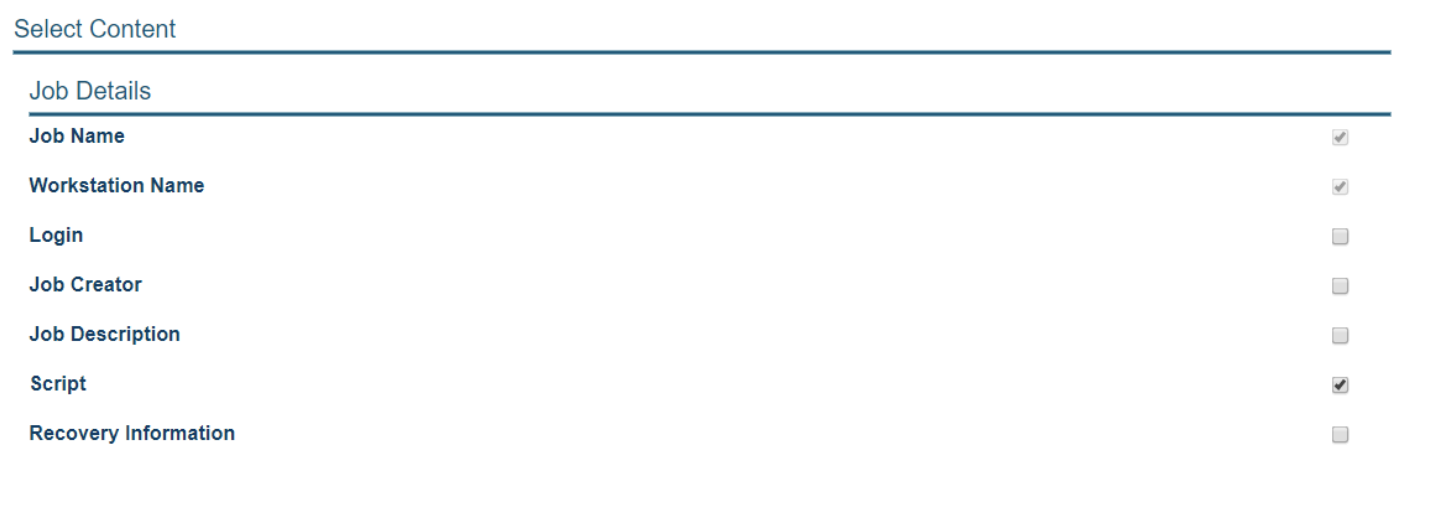 Figure 3: Select Content for JRS. This section is mainly to organize the content of the report on what data you are interested to see in your report. You can choose all the options for a more detailed report. In “Job Statistics” section which is available in the “Report Content” tab for JRS, you get more useful stats like the (Minimum, Maximum, Average). 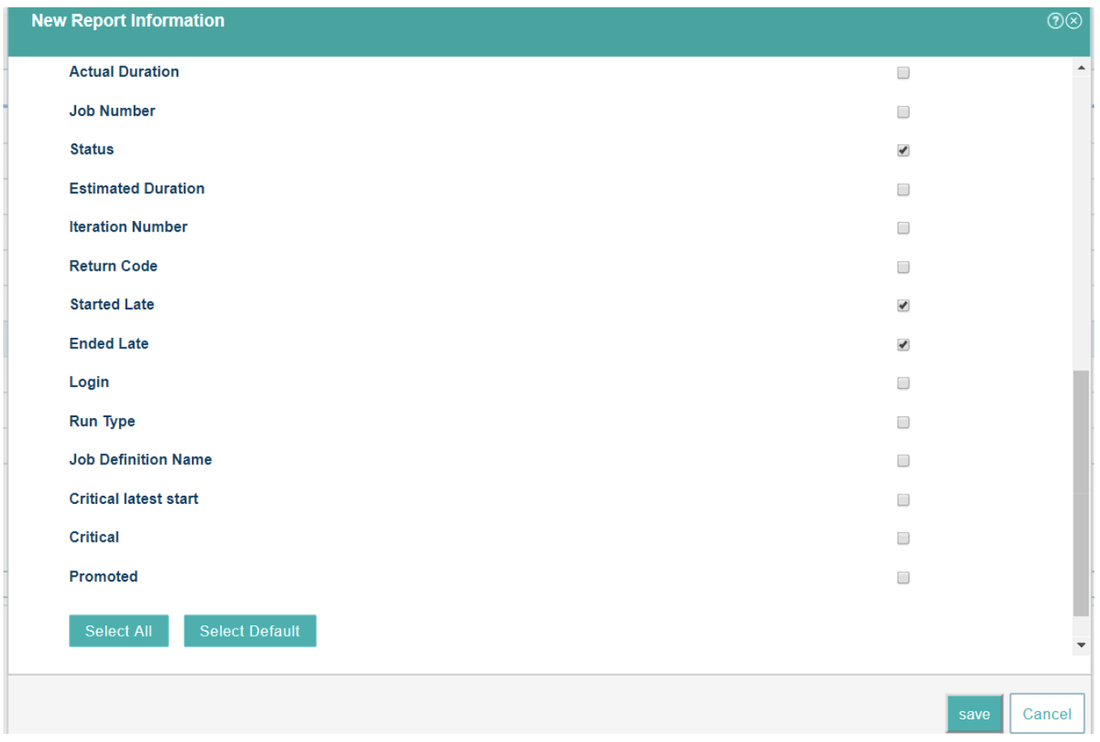 Figure 4: Select Job Information for JRH. In here, you could find more options for you to select which will refine your report for JRH. Finally, we are very close to see the sample generated report. Seems like you are excited to see the report now! Let’s go then! 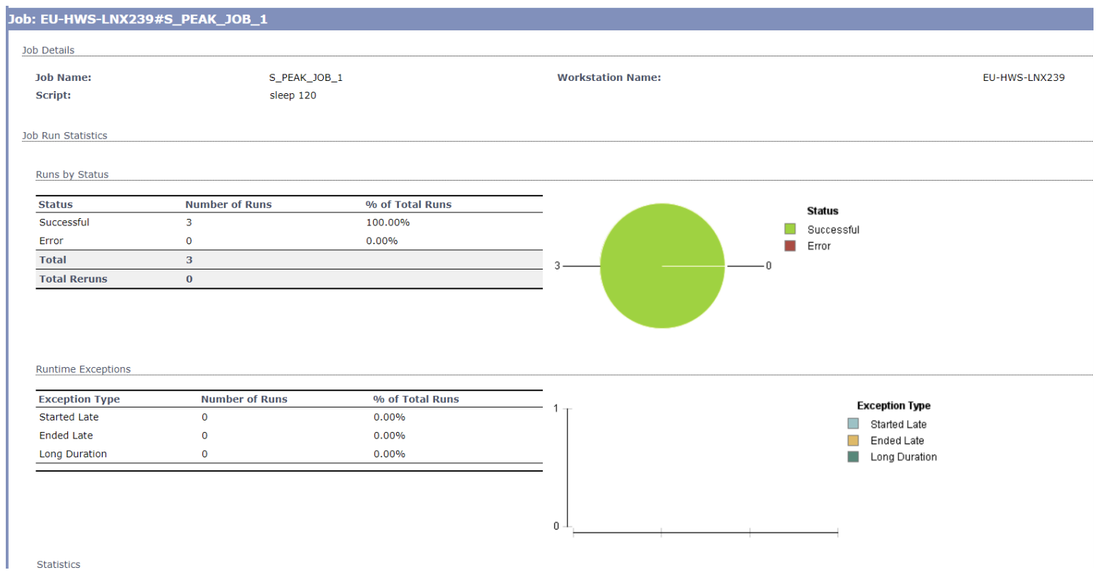 Figure 5: Generated Report part-II for JRS. This shows the below details of the Job:
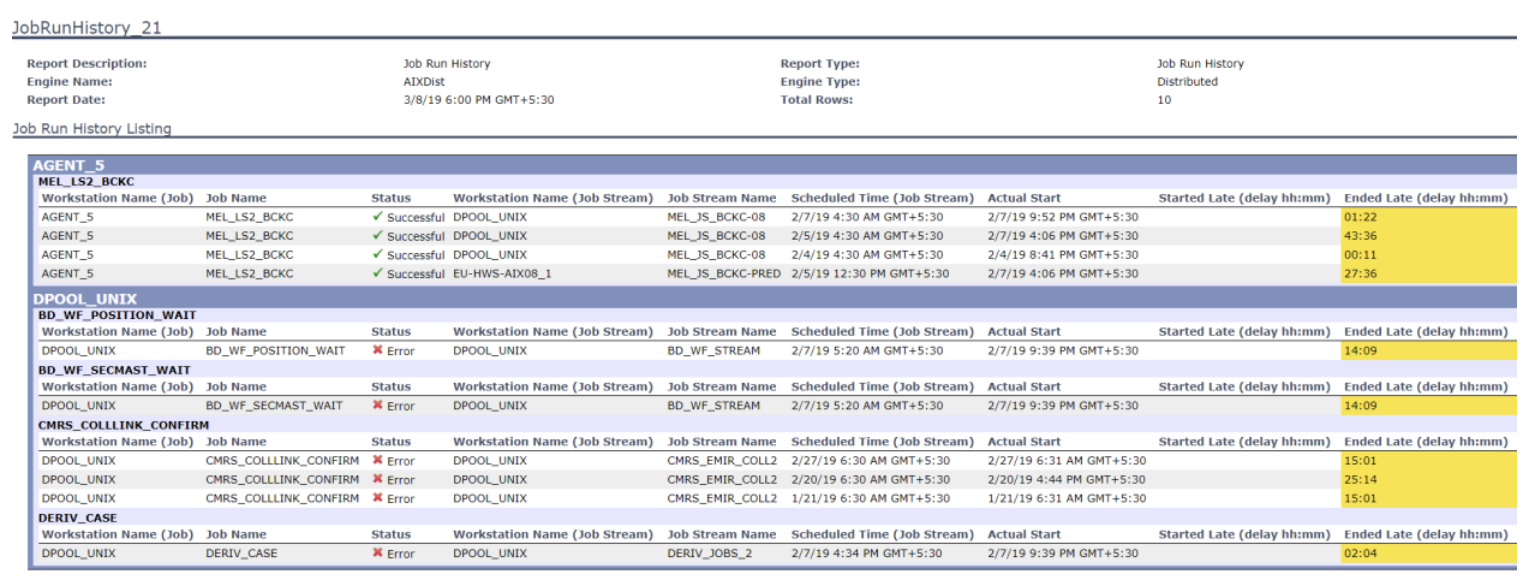 Figure 6: Generated Report for JRH in HTML format. 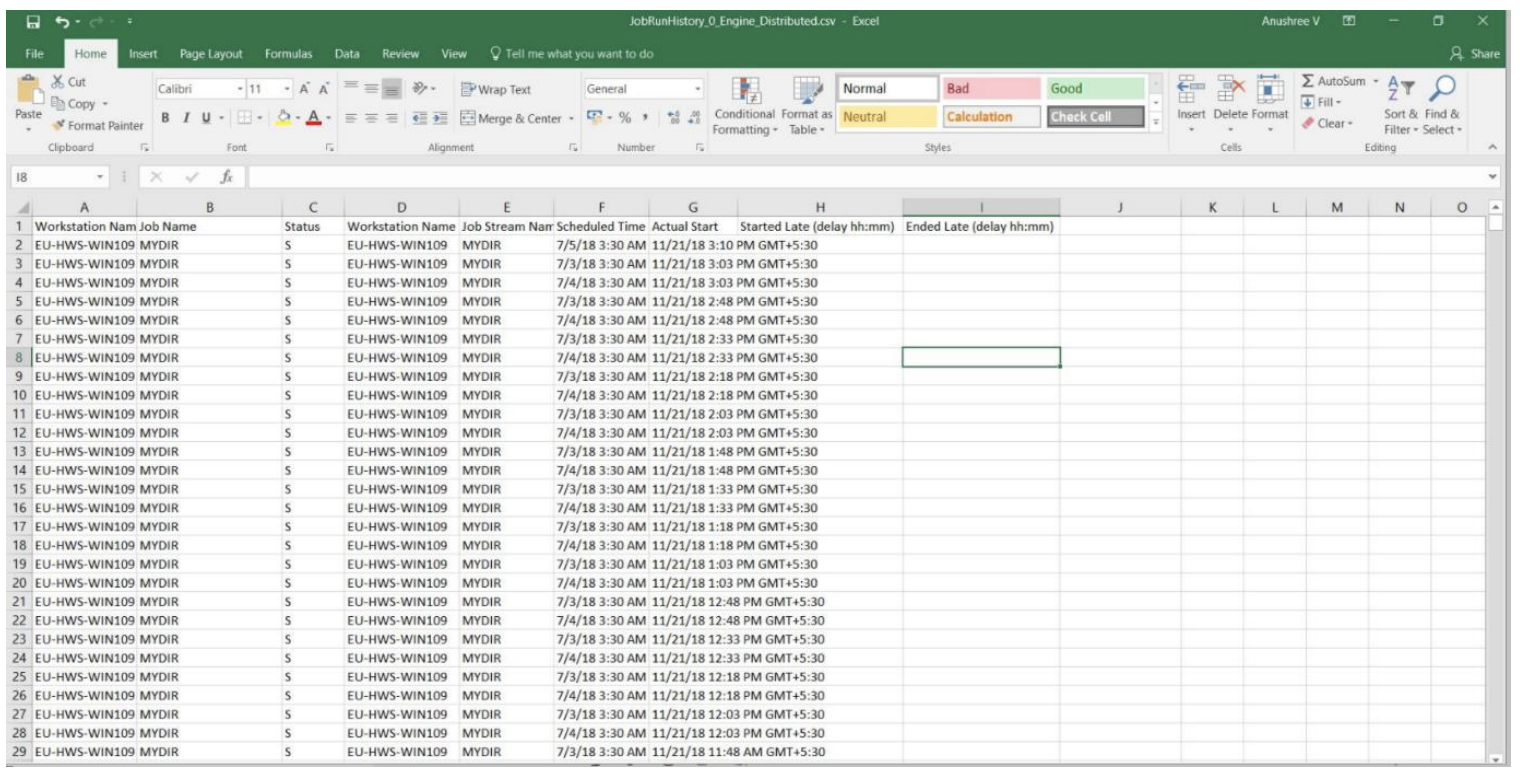 Figure 7: Generated Report for JRH in CSV format. That’s it, felt as very quick tool for you to get the stats? Then why late, let’s all start using the “Reports” effectively now. For any feedback, contact Kancherla Sravani <[email protected]> or Amitkumar Behera <[email protected]>  SRAVANI KANCHERLA, Technical Lead at HCL. Working as full stack developer for the Workload Automation in HCL PNP Bangalore. She has done her Masters at New Jersey Institute of Technology. Worked across geolocations in USA and India. Worked on various technologies as in Java, Spring, BPMN, Cloud, JavaScript, jQuery. She is a AWS Certified Developer. She Love's to code and be on top of new technologies.  AMIT KUMAR BEHERA, Lead Engineer at HCL
Working as Full Stack Developer in HCL Product and Platform Bangalore. He has done his graduation In Electrical Engineering From BPUT. He has worked on Python, React, React Native, Ruby, PHP, JavaScript, SEO, Node Js, Google Analytics, Google Tag Manager. He has interest in singing, love to explore on technical articles.
1 Comment
8/14/2019 04:32:36 am
The hardest part of being employed is managing the workload. If you ask me, there are companies who just do not know how to do it. If you only think of your employees as tools, then your company will never succeed. People are not machines, there are only so much that a person can handle. If you want your employees to last and do will, then you need to properly manage the workload that you give them, that is what I believe. Your comment will be posted after it is approved.
Leave a Reply. |
Archives
July 2024
Categories
All
|
 RSS Feed