 Welcome back! In the first episode Bomb dive into Machine Learning Episode 1, we clarified that Machine Learning is a subclass of the Artificial Intelligence category that includes (but not only) neural networks. Then, we focused on a supervised algorithm called Linear Regression. It is generally used when some sort of linear relation exists between the variables (like for the height and the weight in our model). Finally, we studied how the learning mechanism works in the linear regression and how the same mechanism can be generalized for all the machine learning algorithms. Now it’s time to write some code It is finally time to use our keyboards and apply all the (many) concepts presented in the first episode! Before to start typing variables and functions, we first need to satisfy all the prerequisites. Tools Required Python and Tensorflow in the days of this article are king and queen in the machine learning kingdom. We are going to use them together with other Python libraries like Keras, Scikit and Pandas. All the code will then be implemented inside a Jupyter notebook. It is important to install and configure:
For a support with the installations and configurations I highly suggest to follow this article: https://medium.com/@neuralnets/beginners-quick-guide-for-handling-issues-launching-jupyter-notebook-for-python-using-anaconda-8be3d57a209b Let’s create our sportsman height predictor We are ready to create our sportsman height predictor! We start creating a new Jupyter notebook and importing all the modules we need: Code
Code
Once we have successfully imported the dataset, it is time to prepare its data to be understandable and meaningful for the model. In fact, the dataset in this moment contains some information that cannot be provided to the model as is. In particular, all the non-numerical data needs to be converted in a numeric format. The reason for this is easily understandable remembering the formula that describes the Linear Regression (Y = X1 * W1 + …. + Xn * Wn), assigning to the variable X1 a text value like “basketball” would not make any sense in the formula. A very common technique to deal with non-numerical data is called One Hot Encoding (OHE), it consists in creating a new column in our dataset for every possible value assumed by a certain variable and setting to 1 only the column that corresponds to the sport practiced by the athlete. Considering the case of the variable “sport” in our dataset, if the only sports that appear in our dataset are [ “basketball”, “judo”, “cycling”], we can substitute the column “sport” with the new columns “sport_basketball”, “sport_judo” and “sport_cycling”. If an athlete in the dataset practices the sport “judo”, the values of these 3 columns will be [ 0.0, 1.0, 0.0]. Another problem to deal with, is the meaning of a certain data, even if its value is numeric. An example in this case is represented by the column “age”: while we have already seen how height and width are directly connected, the age is a bit more complex (we can assume that the height of a person grows until an age of 22-23, then it generally stabilizes for a long period and start decreasing). 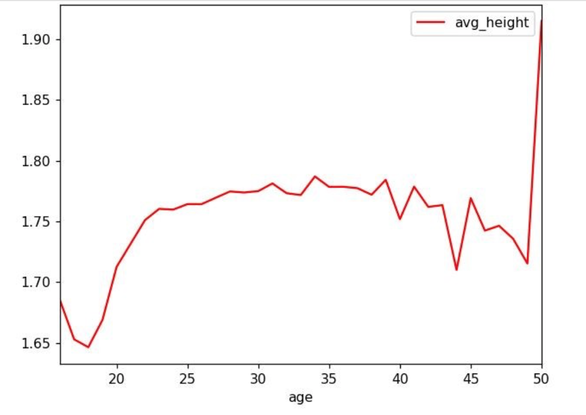 In order to represent this behavior, it would be better to convert the age in different classes and apply the OHE strategy. Code
Now the dataset is ready to be processed by the Linear Regression model … well, almost ready. Before to start the training of the model it is always a good idea to randomly divide all the datasets in 2 parts:
Code
Then, we start the training: Code
After it is finished, it is possible to evaluate its score on the training set (1.0 means that all the predictions are perfect). Code
It does not look bad. We can check also the score evaluated over the validation set: Coda
The score looks very similar to the one on the training set, that’s a good news! The model now is fully trained and works well, we can start producing our predictions. We can create a support class to simplify the creation of the athletes in the format requested by the model. Code
We previously mentioned that a judoka should be shorter than a basketball player of equal weight, now we can test this affirmation using our model! Code
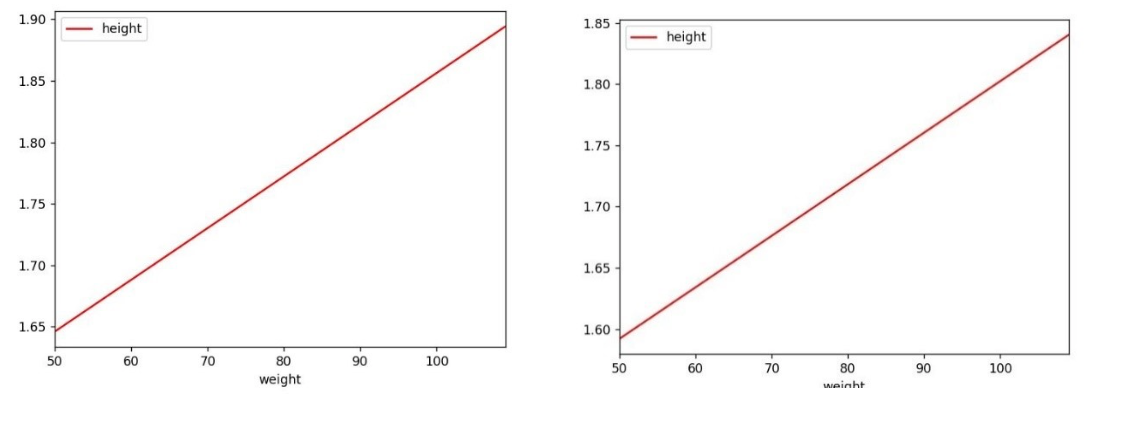
Another useful information our model can provide now, is a description of how the height changes in relation to the weight for every different sport (with this information it would possible to improve the sizes of the sportswear focusing only on a certain range of heights). Code
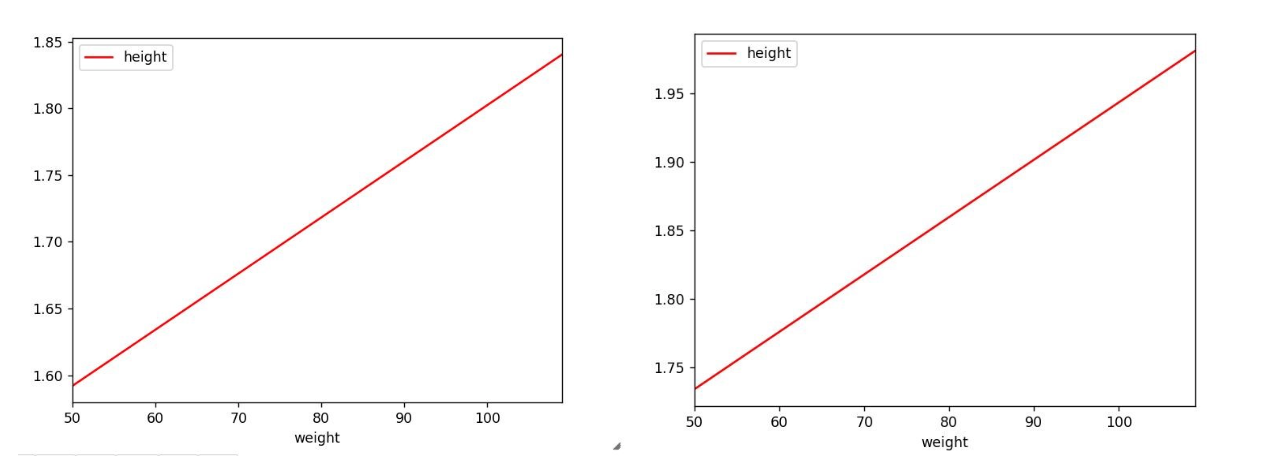 It is interesting to repeat the same analysis comparing the gender on the same sport: Code
 Using the trained model, it is now possible to calculate the best body height to associate to each size and sport: Code
You can find the complete version of the code presented in this article on github. This is the end … for now I would like to personally thank you for completing successfully this 2nd “bomb dive” in the machine learning deep ocean. Even if this is the end of our journey together, I hope that this article could be just the beginning of your new personal journey in this field. If you enjoyed this article and would like to read more contents about Machine Learning, feel free to leave a comment and/or a preference on a topic you would like to read about in the next article. Do you have any feedback? If you want to leave a feedback, if you notice some errors in the article, or if you just want to discuss a bit more about Machine Learning in general, you are very welcome to contact me at [email protected]
0 Comments
Your comment will be posted after it is approved.
Leave a Reply. |
Archives
July 2024
Categories
All
|

 RSS Feed