|
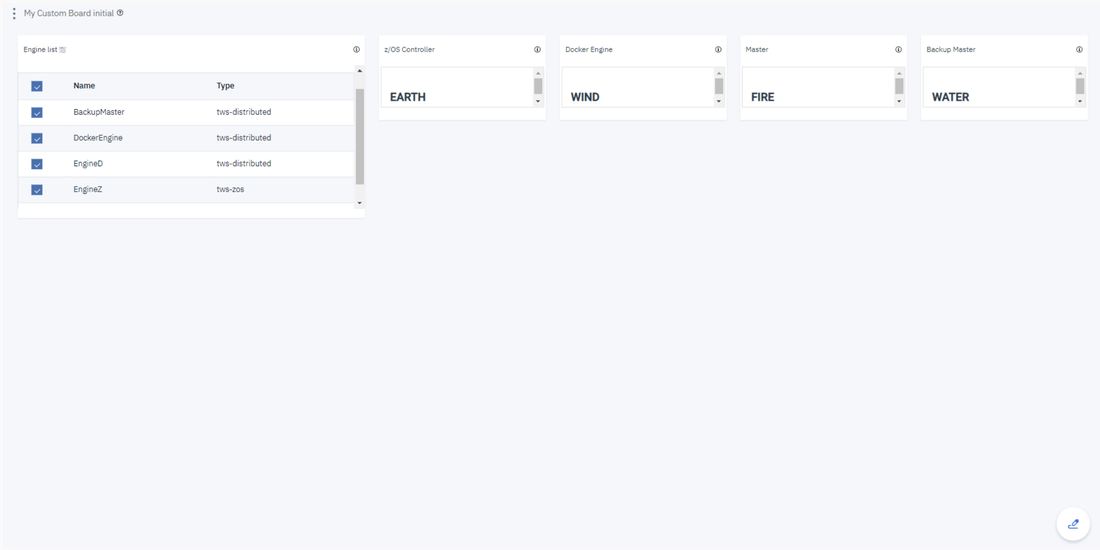
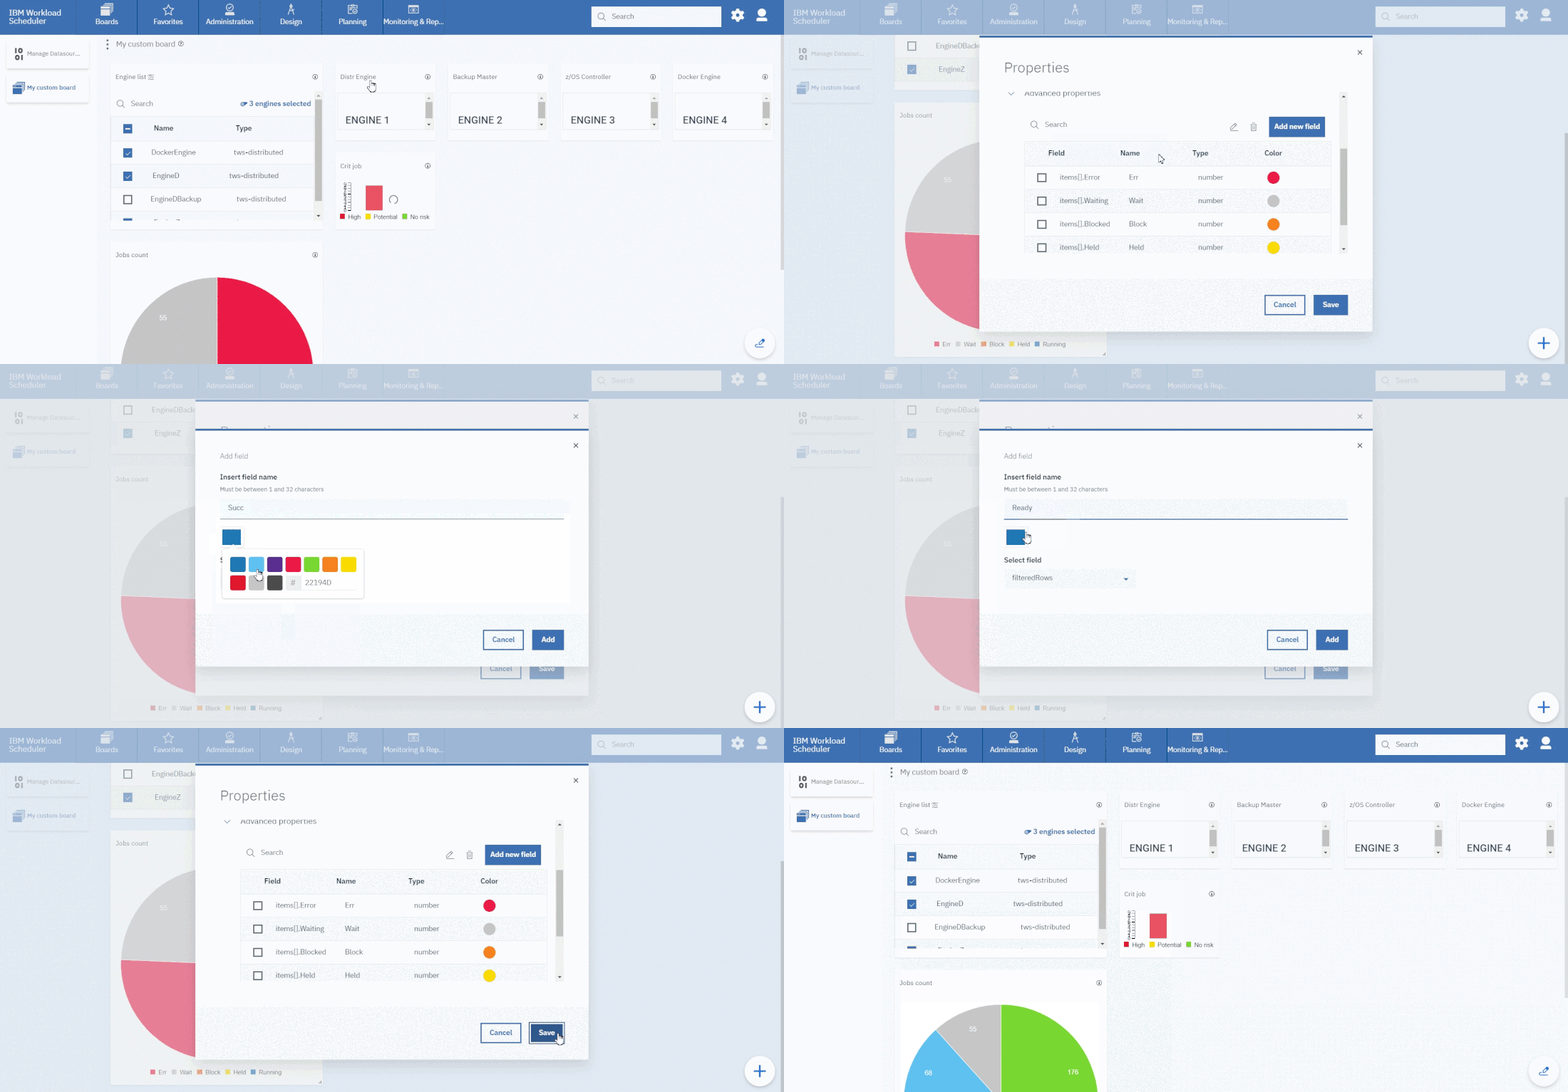
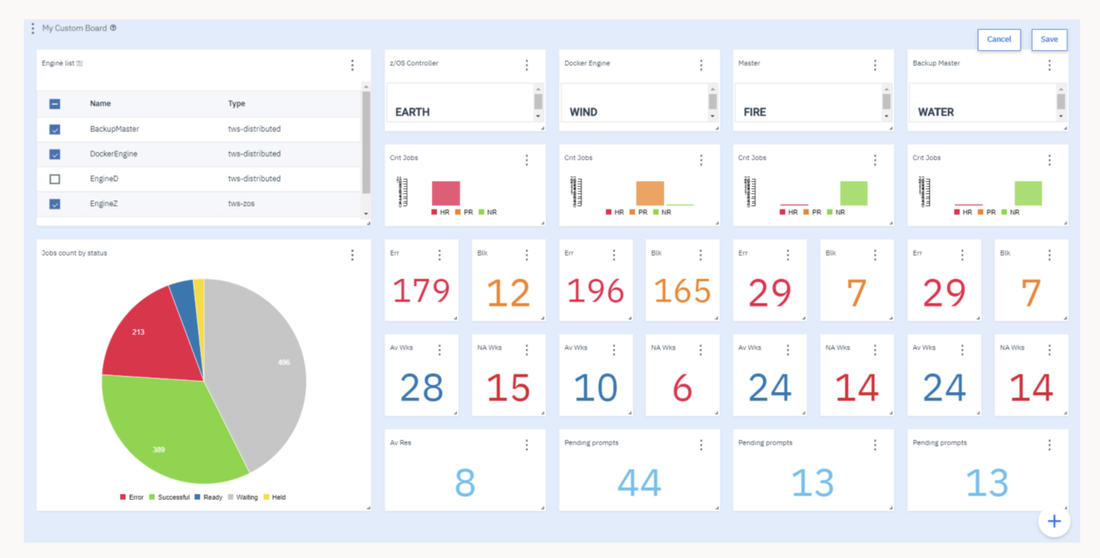
No matter if your environment is based on rock solid z/OS controller or on light weight and easily scalable docker instances, or if your distributed, on premises master and backup master are rocking your workload as fire and water. Earth, wind, water and fire… if you want to have control over each element you need the fifth spirt: your custom dashboard! It’s easy to create and customize your dashboard to have control over every single important aspect for you and your organization at a glance. Each dashboard is composed by several data sources and widgets that can be customized and combined together in the new era of dashboards. But you can also optimize your dashboard to monitor different kinds of environments all together. Let’s see how it works. Cross-engine widgets If you need an overview of the entire workload across all of your environments, you can use for example the Jobs count by status datasource in a pie chart to have a quick overview of how many jobs are waiting, running or ended in error or in successful state. To make this datasource and widget works across multiple environment you need to add first an engine list. D engine list and Z engine list are optimized for homogeneous environment, while for an hybrid (distributed and z/OS) environment you have to select the Engine list. At this point you can add also the desired widget and customize all fields as you can see below. Widgets based on datasource with pre-defined engine. However, the best way to monitor hybrid environment is to use specific datasources for each engine. For example, if you need to monitor the Critical jobs
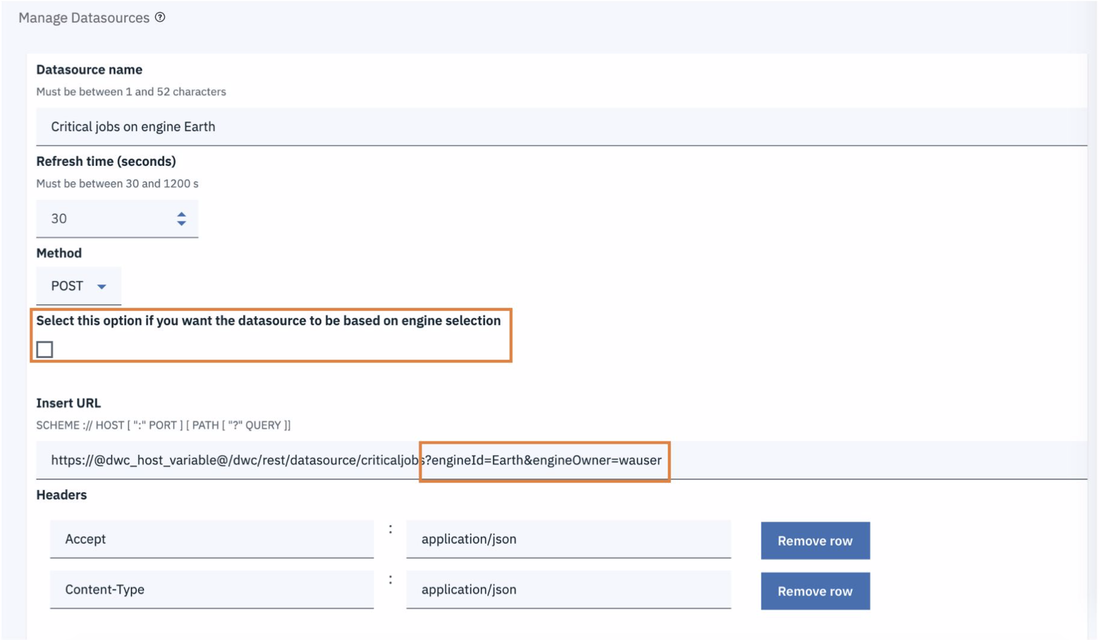
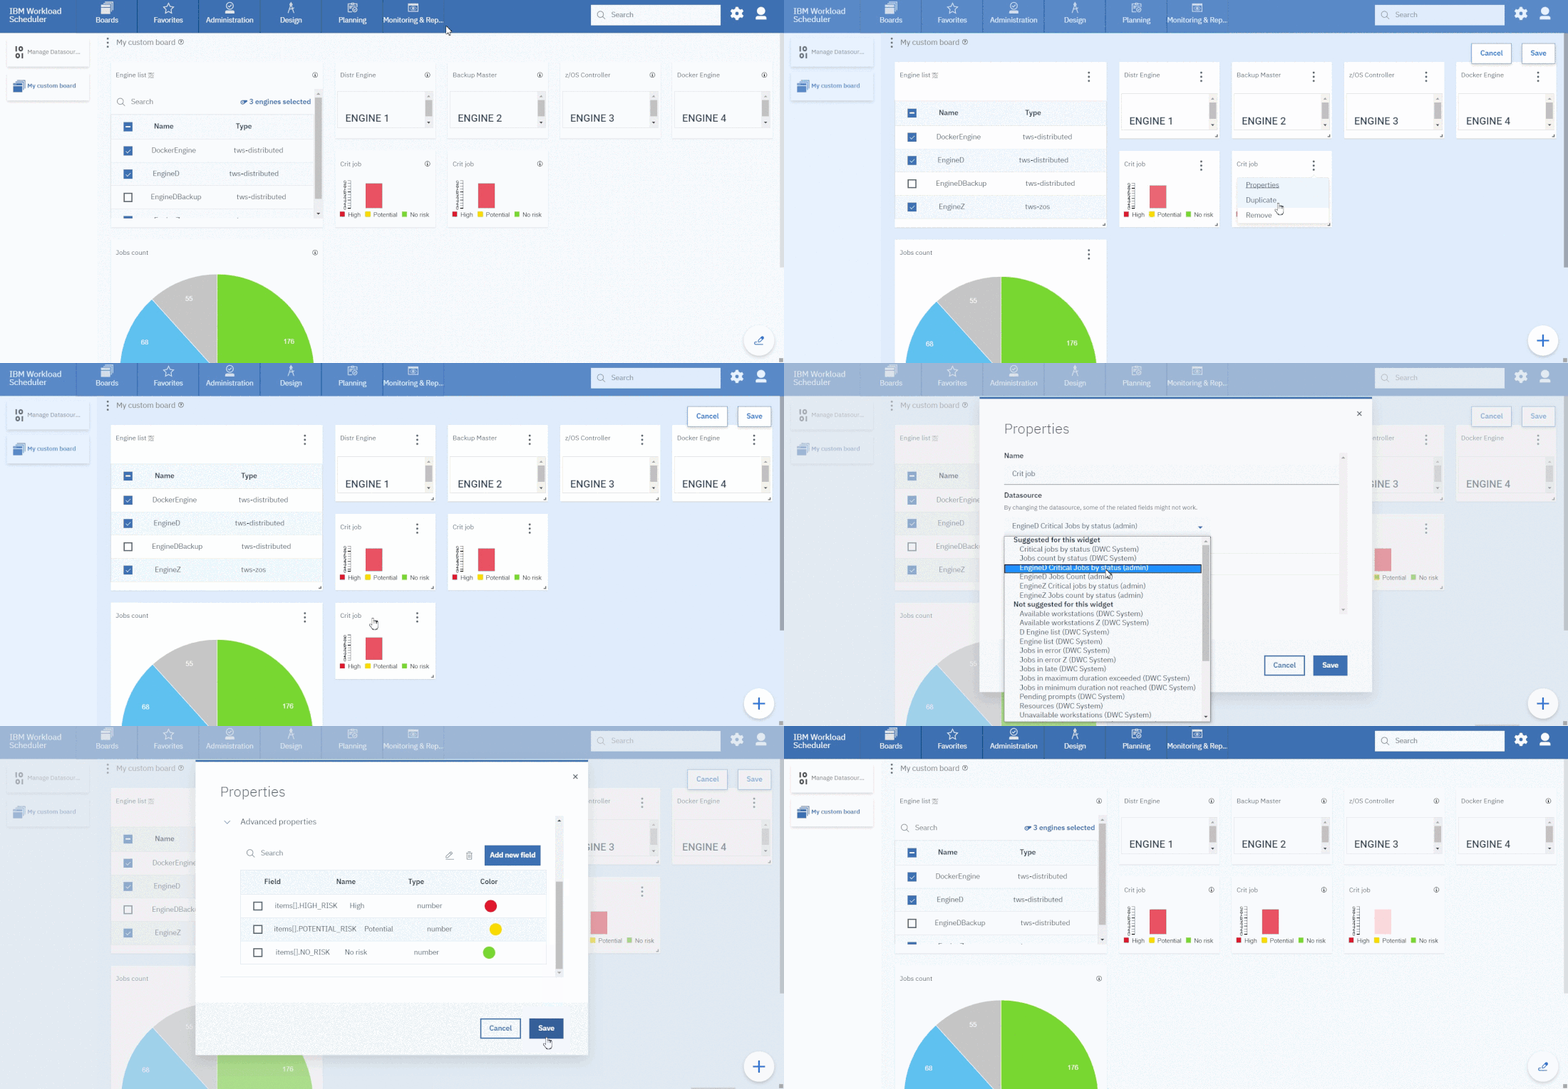
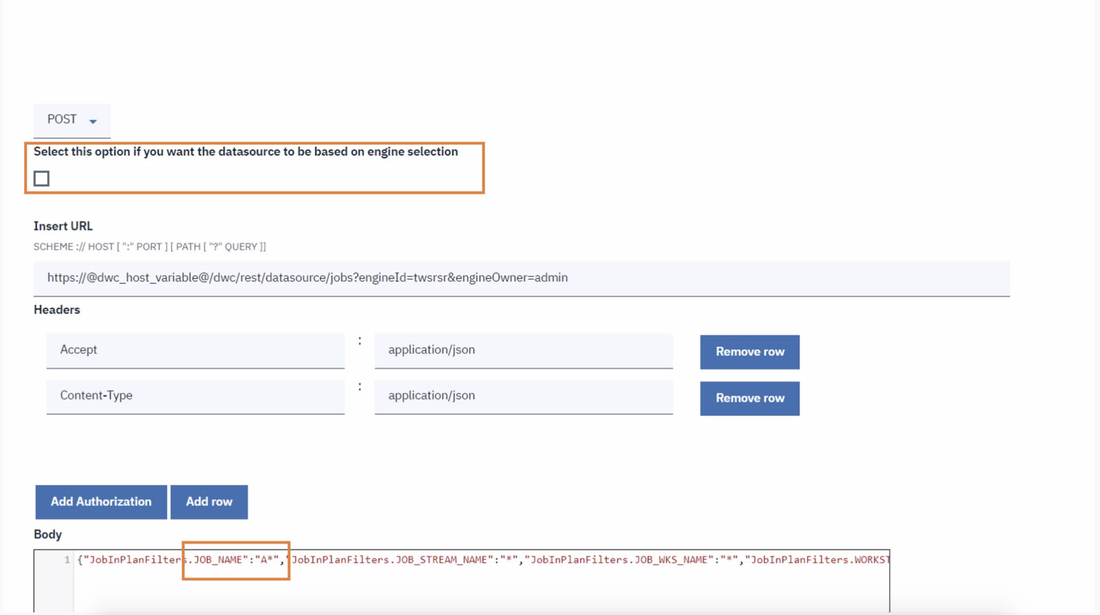
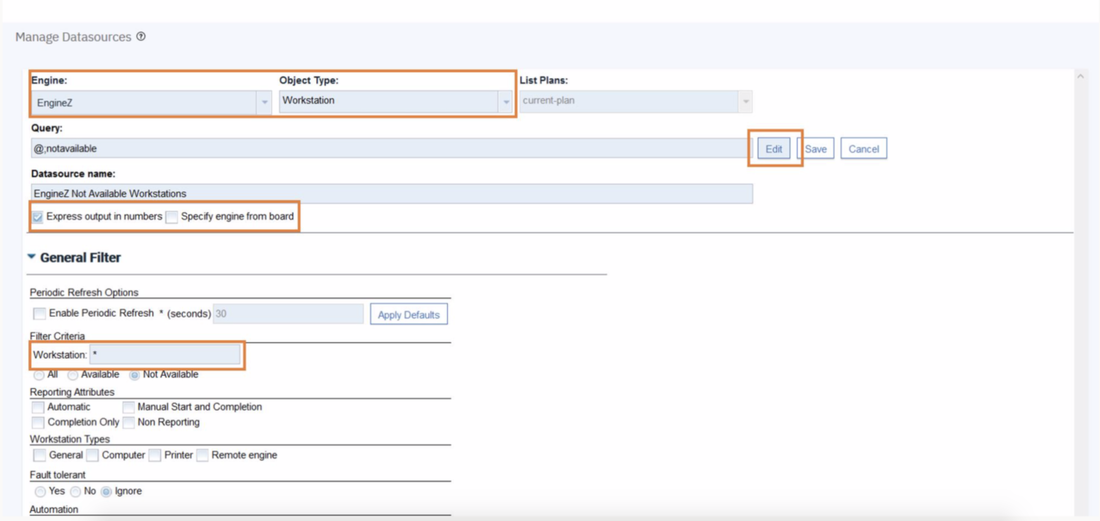
Repeat the three steps for each engine. The customization steps are the same for distributed and z/OS engine. Now that your 4 datasources are ready you can go back to your dashboard and easily create the four widgets. As you can see, once you have customised your first widget, you can just duplicate it and change the associated datasource. It’s easy and time saving; you can take advantage of this tip every time you want to define multiple widgets on similar datasources. Add filters to your datasources You can also refine the datasources to monitor specific subset of your workload, for example to count only the jobs belonging to a specific Line of Business or the workstations matching a specific naming convention. In case you are working on a REST datasource, such as the job count by status, you can just start from an existing datasource and duplicate it. Remember to deselect the checkbox “Select this option if you want the datasource to be based on engine selection” and specify the engine name and owner (if they are not already configured). Then you have to simply add the desired filters in the body section. Note that the filters available on distributed engines are JOB_NAME, JOB_STREAM_NAME, JOB_WKS_NAME and WORKSTATION, while on z/OS engines are allowed only the filters on JOB_NAME, JOB_STREAM_NAME and JOB_WKS_NAME. In case you are working on a Plan datasource, such as the Available or Unavailable Workstations, it’s even easier:
Once that you have learned how to manage, customize, filter and even optimize your plan and rest api datasources you can basically have under control everything in your environment. No matter if you are interested in the unanswered prompts on your distributed master or in the special resources on your z/OS controller, now you can tames all of your environments from a single point of control. Author's BIO
0 Comments
Your comment will be posted after it is approved.
Leave a Reply. |
Archives
July 2024
Categories
All
|



 RSS Feed