|
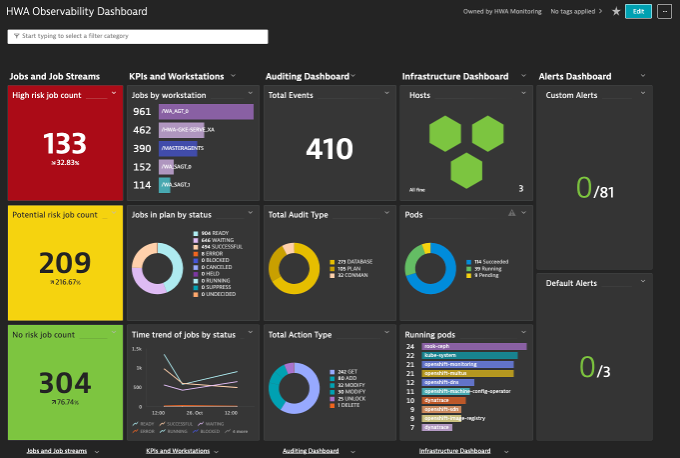
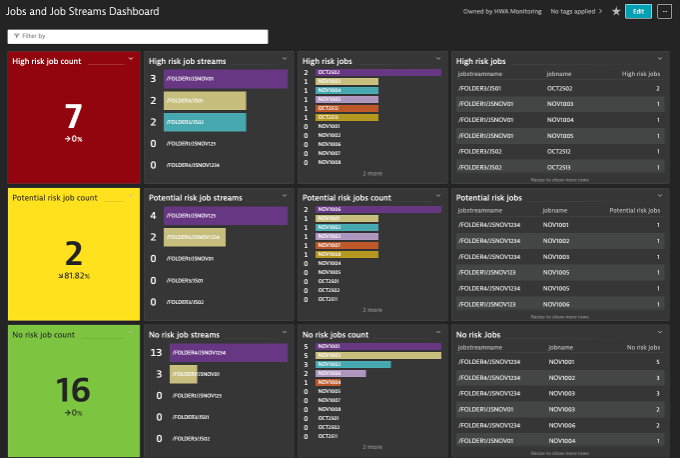
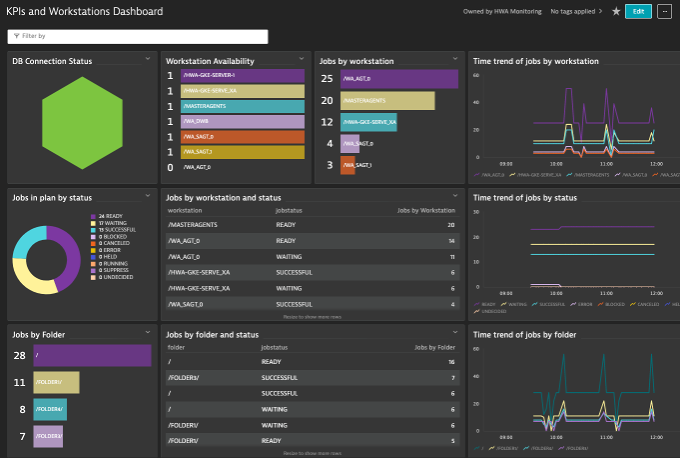
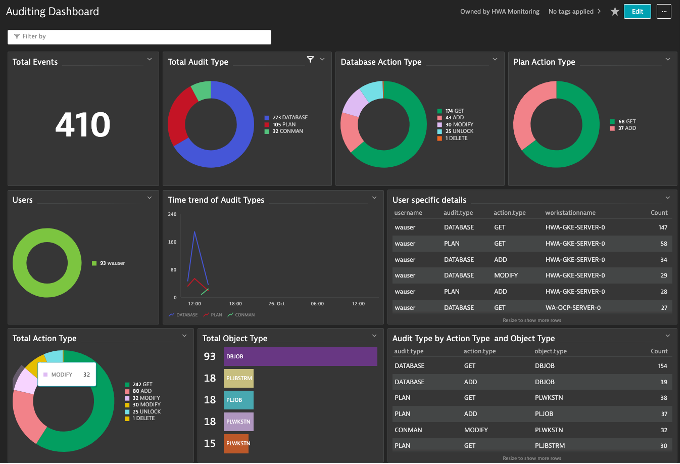
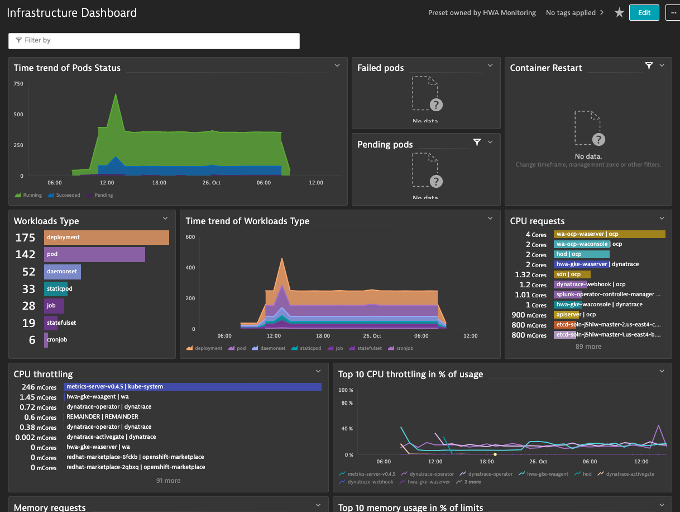
We already talked a lot about the importance of Observability in digital business applications and how it has "replaced" the concept of Monitoring, enabling complete end-to-end visibility into business applications, systems, APIs, microservices, network, infrastructure, and more. In this blog let’s focus on why we chose Dynatrace as an additional integration and how this integration works. Gartner has named Dynatrace as a Leader in the 2022 Magic Quadrant for Application Performance Monitoring (APM) and Observability. Dynatrace has much more to offer than a simple APM solution, and it can fathom all sides of the observability of an application simultaneously. Observability from the Dynatrace platform extends beyond metrics, logs, and traces to user experience data, runtime security data, and data from the latest open-source standards, such as Open-Telemetry. Dynatrace (SaaS and Managed) is capable of ingesting data from applications like HCL Workload Automation (HWA) and the data can then be auto detected and ingested to database which in turn converts it to individual events and metrics, ready to be filtered and displayed in dashboards. HWA Observability Dashboard for Dynatrace is a solution developed, and HWA integration has been made with Dynatrace. This integration comes with predefined dashboards which can be deployed on Dynatrace. In these dashboards, you can view the whole status of your workloads at a glance for the engine you have configured. The overview dashboard provides a single, consolidated view for monitoring the activities, infrastructure, jobs, job-streams, workstations status etc. And you can drilldown in each dashboard for more complete data insights. Dashboard: Jobs and Job-Streams Description: Jobs and Job-Streams dashboard display the status and insights of HWA Jobs, Critical jobs, and Job Streams. Input Source: HWA Deployment events sidecar container and HWA server Logs Dashboard: KPIs and Workstations Description: KPIs and Workstations dashboard display the HWA KPIs information and allow drilldown to see the timeseries data in visual representation for defined KPIs. Input Source: API exposed by HWA Server Dashboard: Auditing Dashboard Description: Auditing Dashboard display workstations and audit information such as activities performed by users. Input Source: HWA sidecar containers; DB auditing and Plan auditing Dashboard: Infrastructure dashboard Description: Infrastructure dashboard display overview of infrastructure details of HWA deployed on Kubernetes environment. Input Source: Infrastructure Logs exposed by Kubernetes cluster where HWA is deployed Conclusion Although there are many Observability tools available in the market, HWA is integrating with the top ones, like Dynatrace. By using predefined dashboard capability of Dynatrace, this integration is great to visualize KPIs, search and filter data among large volumes of logs, and visualize them in dashboards. Watch this demo HWA Observability Dashboard for Dynatrace to learn more as you plan for your HWA Observability strategy that cuts through all the blind spots and reduce your mean-time-to-issue-resolution. Additional integrations with other top Observability tools will come in the future so, stay tuned! Author's Bio
0 Comments
Your comment will be posted after it is approved.
Leave a Reply. |
Archives
July 2024
Categories
All
|



 RSS Feed