|
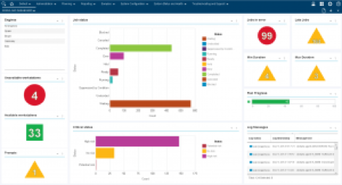
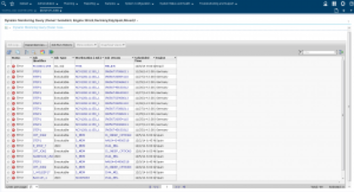
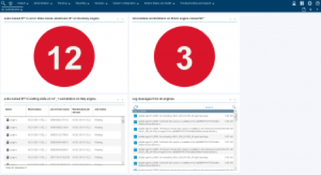
Have you ever dreamed of a real time, easy-to-use, global dashboard where you could easily understand in case of problems, what's going wrong in your environment and use the same dashboard to perform a fast response to those problems? Well, now you have it! Workload Automation – offered as both on-Cloud and on-premise solutions – is proud to announce the new Workload Dashboard 2.0! The new Workload Dashboard will help you both monitor and manage all your workload from a single point of access. With the new Workload Dashboard you will be able to monitor jobs, workstations, critical jobs and much more from one or several engines (distributed and z/OS), with a single view! Moreover, with just a simple click on the engine list on the top left, the dashboard will be updated accordingly to the user choice, showing the correct workload data from the selected engine. You can use the Workload Dashboard not only for monitoring but also to manage your workload by simply clicking on those widgets. All the widgets will redirect you to the correct page where you can manipulate your selected workload, performing all the actions needed for a fast response in case of failures, like re running jobs, linking workstations, showing job logs and so on. But maybe that's not the dashboard you want and you have always dreamed, maybe there are more information than the ones you really want and maybe those ones are not even there. In this case, you can create your own dashboard! You can use the widgets provided by DASH, and thanks to our data providers you can create in few easy steps your customized dashboard, focusing on the exact workload you want to monitor and manage. Our data providers allow you to retrieve the data you are interested in and also filter through it, with all type of filters, from the job name to the workstation status. Your personal dashboards can be also enabled for mobile, so that you can directly check them from your mobile devices! Here is a video that will show you how to interact with the Workload Dashboard and how you can create your own customized dashboard. Try it now! Start using Workload Dashboard with a free 30-day trial from IBM Marketplace! You can explore Workload Dashboard with sample data from IBM Dynamic Workload Console, or use the trial version with your own scheduling environment! If you want to start creating your own personal dashboards, you can request access to the Beta program. Let me know what you think of the new Workload Dashboard leaving a comment below!
Gabriele Barboni is currently a Software Engineer and developer for Workload Automation since 2013. He has a background in computer science technologies. Gabriele specializes in design and development of web-oriented interfaces, in particular, during his experience in IBM and HCL, he gained strong skills on IBM Workload Scheduler, IBM Dynamic Workload Console and IBM Application Lab.
4 Comments
Laurence Tsai
7/3/2017 09:52:02 am
Dears, my client is asking how to have those error job list with flashing (blink?) on the customized dashboard?
Reply
Gabriele Barboni
7/4/2017 02:56:22 am
Hi Laurence,
Reply
Laurence
7/16/2017 10:13:32 pm
Dear sir ,
Gabriele Barboni
7/13/2017 08:18:58 am
Hi,
Reply
Your comment will be posted after it is approved.
Leave a Reply. |
Archives
July 2024
Categories
All
|


 RSS Feed