WORKLOAD AUTOMATION COMMUNITY
  • Home
  • Blogs
  • Forum
  • Resources
  • Events
    • IWA 9.5 Roadshows
  • About
  • Contact
  • What's new

See your scheduling metrics on Prometheus and Grafana

9/28/2022

0 Comments

 
Picture
Recently versions of Workload Automation product are capable of seamless integrating with observability products such as Dynatrace, Instana, Datadog, Splunk and others. This is useful specially for companies that has a large operations teams which are already monitoring applications on those observability solutions.
Having the job / scheduling metrics, logs and events and co-relating them with actual application performance data, makes easy to uncover bottlenecks, identify potential SLAs breaches as well as making easy for the operator or SRE to identify jobs running/abending on the environment.

In this blog post I will describe one of the pillars of observability from a Workload Automation point of view. HWA / IWA has exposed it’s metrics for the main components, the back-end (Master Domain Manager) which reports metrics around job execution as well as the health of it’s application server (Websphere liberty). As well as the front-end web user interface (Dynamic workload console – DWC).

Those metrics are exposed in openmetrics format, which is a vendor neutral format widely adopted by the community, it originated from the Prometheus project and it’s been the standard way to report metrics for cloud native applications.        

For IBM / HWA to start reporting metrics we should first enable to openmetrics endpoint on all Websphere components (MDM / BKMDM / DWC). The process is well documented here.

Once performed, the endpoints will be available on the HTTP/HTTPS ports: https://MDMIP:31116/metrics and https://DWCIP:9443/metrics

When accessing the links we should see the openmetrics format data:
# TYPE base_REST_request_total counter
# HELP base_REST_request_total The number of invocations and total response time of this RESTful resource method since the start of the server. The metric will not record the elapsed time nor count of a REST request if it resulted in an unmapped exception. Also tracks the highest recorded time duration within the previous completed full minute and lowest recorded time duration within the previous completed full minute.
base_REST_request_total{class="com.ibm.tws.twsd.rest.engine.resource.EngineResource",method="getPluginsInfo_javax.servlet.http.HttpServletRequest"} 39
base_REST_request_total{class="com.ibm.tws.twsd.rest.plan.resource.JobStreamInPlanResource",method="getJobStreamInPlan_java.lang.String_java.lang.String_javax.servlet.http.HttpServletRequest"} 170
base_REST_request_total{class="com.ibm.tws.twsd.rest.model.resource.JobStreamModelResource",method="getJobStreamById_java.lang.String_java.lang.Boolean_javax.servlet.http.HttpServletRequest"} 51
base_REST_request_total{class="com.ibm.tws.twsd.rest.model.resource.FolderModelResource",method="getFolderById_java.lang.String_java.lang.Boolean_javax.servlet.http.HttpServletRequest"} 4
base_REST_request_total{class="com.ibm.tws.twsd.rest.eventrule.engine.resource.RuleInstanceEventRuleResource",method="queryNextRuleInstanceHeader_com.ibm.tws.objects.bean.filter.eventruleengine.QueryEventRuleEngineContext_javax.servlet.http.HttpServletRequest"} 5
base_REST_request_total{class="com.ibm.tws.twsd.rest.engine.resource.EngineResource",method="parametersToJsdl_com.ibm.tws.objects.bean.engine.ParametersInfo_javax.servlet.http.HttpServletRequest"} 1
base_REST_request_total{class="com.ibm.tws.twsd.rest.model.resource.FolderModelResource",method="getFolderContent_com.ibm.tws.objects.bean.model.FolderContentParameters_javax.servlet.http.HttpServletRequest"} 79
base_REST_request_total{class="com.ibm.tws.twsd.rest.eventrule.engine.resource.AuditRecordEventRuleResource",method="queryAuditRecordHeader_com.ibm.tws.objects.bean.filter.eventruleengine.QueryFilterEventRuleEngine_java.lang.Integer_javax.servlet.http.HttpServletRequest"} 105
base_REST_request_total{class="com.hcl.wa.wd.rest.ResourceBundleService",method="getBundle_javax.servlet.http.HttpServletRequest"} 39
base_REST_request_total{class="com.ibm.tws.twsd.rest.model.resource.EventRuleModelResource",method="getEventRuleById_java.lang.String_java.lang.Boolean_javax.servlet.http.HttpServletRequest"} 17
base_REST_request_total{class="com.ibm.tws.twsd.rest.model.resource.EventRuleModelResource",method="queryEventRuleHeader_com.ibm.tws.objects.bean.filter.model.QueryFilterModel_java.lang.Integer_java.lang.Integer_java.lang.Integer_javax.servlet.http.HttpServletRequest"} 19
base_REST_request_total{class="com.ibm.tws.twsd.rest.model.resource.JobDefinitionModelResource",method="listKeys_java.lang.String_java.lang.String_java.lang.String_javax.servlet.http.HttpServletRequest"} 3
base_REST_request_total{class="com.ibm.tws.twsd.rest.model.resource.EventRuleModelResource",method="updateEventRule_java.lang.String_java.lang.Boolean_java.lang.Boolean_com.ibm.tws.objects.rules.EventRule_javax.servlet.http.HttpServletRequest"} 1
base_REST_request_total{class="com.ibm.tws.twsd.rest.model.resource.WorkstationModelResource",method="unlockWorkstations_java.lang.String_java.lang.Boolean_java.lang.Boolean_javax.servlet.http.HttpServletRequest"} 1
base_REST_request_total{class="com.hcl.wa.fileproxy.rest.FileProxyResources",method="proxyPutResponse_java.lang.String_java.lang.String_java.io.InputStream_javax.servlet.http.HttpServletResponse"} 26
base_REST_request_total{class="com.hcl.wa.wd.rest.JsonService",method="getObjectProps_java.lang.String_java.lang.String_java.lang.String_java.lang.String_java.lang.String_java.lang.String_java.lang.String_java.lang.String_javax.servlet.http.HttpServletRequest"} 15 
 ​
If the endpoints properly reporting the metrics we now move into sending the data to observability products. In our case we will leverage Prometheus as monitoring solution, we will set up Prometheus to scrape the HWA/IWA openmetrics endpoints so it’s ingested by it and once in there we are able to setup alerts or dashboards.

Bellow is a Prometheus configuration example (/etc/prometheus/prometheus.yml) to scrape IWA/HWA’s openmetrics endpoints. Note the scrape_interval of 1 minute as well as we are disabling tls verification.
​
In bellow example the MDM https port is 31116 and DWC’s is 443 (the default is 9443).
 
  - job_name: 'hwa_mdm'
    scheme: https #change to http if don't you have https
    scrape_interval: 1m
    scrape_timeout: 5s
    static_configs:
            - targets: ['10.134.240.80:31116']
    tls_config:
      insecure_skip_verify: true
    metrics_path: "/metrics"
    basic_auth:
      username: '$USERNAME'
      password: '$PASSWORD' 
 
  - job_name: 'hwa_dwc'
    scheme: https #change to http if don't you have https
    scrape_interval: 1m
    scrape_timeout: 5s
    static_configs:
            - targets: ['10.134.240.80:443']
    tls_config:
      insecure_skip_verify: true
    metrics_path: "/metrics"
    basic_auth:
      username: '$USERNAME'
      password: '$PASSWORD' 
 
        # The job name is added as a label `job=<job_name>` to any timeseries scraped from this config.
  - job_name: "prometheus"
 
    # metrics_path defaults to '/metrics'
    # scheme defaults to 'http'.
 
    static_configs:
      - targets: ["localhost:9090"]
​After recycling Prometheus, I can see the targets available on Prometheus’s UI.
Picture
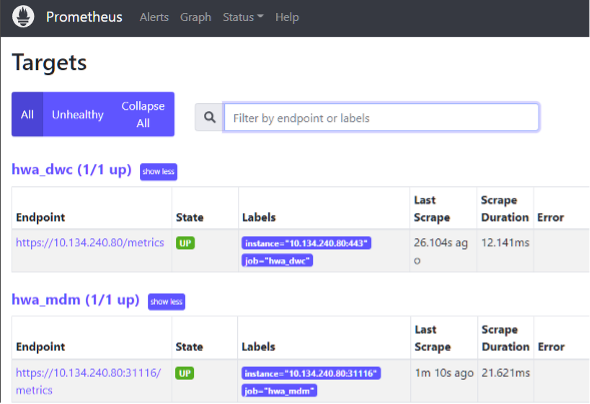
Figure 1 Prometheus targets

With the data been received on Prometheus I am also able to search it by running promql queries as well as visualizing graphics.
Picture
​Figure 2 Prometheus metrics

Below picture shows a promql query to list jobs in error by workstation.
Picture
Figure 3 Prometheus error jobs by workstation

By validating the metrics are being reporting properly on prometheus we can now leverage Grafana to display and build dashboards or/and leverage alertmanager to be alerted in case of issues.

Regarding to Grafana, we can now leverage the Grafana dashboard available on yourautomationhub.io. The dashboard was built for Grafana with relevant data for scheduling environments. To use it on Grafana, first we need to define the prometheus datasource, according to below picture.
Picture
Figure 4 Grafana's Prometheus datasource

Them all it takes is to import the HWA / IWA dashboard from Grafana’s import section. Type the id 14692 and it should load the dashboard automatically. Select the folder and the prometheus datasource name we did set up on the previous step and click import.
Picture
Figure 5 Import dashboard on grafana

Once imported we can see all the metrics that is collected by prometheus on grafana’s dashboard:
Picture

Author's Bio

Picture
Juscelino Candido de lima Junior
HCL Workload Automation - IT Architect/Technical Advisor

Juscelino has over 15 years in the IT industry, at IBM, he started as an IT Specialist - Workload Automation,  in the last five years working as an infrastructure and application IT architect. His areas of expertise include multi-cloud architecture, containers, microservices, observability, virtualization, networks, distributed systems, systems administration, production control, and enterprise job scheduling. IBM Master Inventor with +20 filed patents.
View my profile on LinkedIn
0 Comments

Your comment will be posted after it is approved.


Leave a Reply.

    Archives

    January 2023
    December 2022
    September 2022
    August 2022
    July 2022
    June 2022
    May 2022
    April 2022
    March 2022
    February 2022
    January 2022
    December 2021
    October 2021
    September 2021
    August 2021
    July 2021
    June 2021
    May 2021
    April 2021
    March 2021
    February 2021
    January 2021
    December 2020
    November 2020
    October 2020
    September 2020
    August 2020
    July 2020
    June 2020
    May 2020
    April 2020
    March 2020
    January 2020
    December 2019
    November 2019
    October 2019
    August 2019
    July 2019
    June 2019
    May 2019
    April 2019
    March 2019
    February 2019
    January 2019
    December 2018
    November 2018
    October 2018
    September 2018
    August 2018
    July 2018
    June 2018
    May 2018
    April 2018
    March 2018
    February 2018
    January 2018
    December 2017
    November 2017
    October 2017
    September 2017
    August 2017
    July 2017
    June 2017
    May 2017

    Categories

    All
    Analytics
    Azure
    Business Applications
    Cloud
    Data Storage
    DevOps
    Monitoring & Reporting

    RSS Feed

www.hcltechsw.com
About HCL Software 
HCL Software is a division of HCL Technologies (HCL) that operates its primary software business. It develops, markets, sells, and supports over 20 product families in the areas of DevSecOps, Automation, Digital Solutions, Data Management, Marketing and Commerce, and Mainframes. HCL Software has offices and labs around the world to serve thousands of customers. Its mission is to drive ultimate customer success with their IT investments through relentless innovation of its products. For more information, To know more  please visit www.hcltechsw.com.  Copyright © 2019 HCL Technologies Limited
  • Home
  • Blogs
  • Forum
  • Resources
  • Events
    • IWA 9.5 Roadshows
  • About
  • Contact
  • What's new