|
Don’t get left behind! The new era of digital transformation of businesses has moved on tonew operating models such as containers and cloud orchestration. Let’s find out how to get the best of Workload Automation (WA) by deploying the solution on a cloud-native environment such as Amazon Elastic Kubernetes Service (Amazon EKS). This type of deployment makes the WA topology implementation 10x easier, 10x faster, and 10x more scalable compared to the same deployment in an on-premises classical platform. In an Amazon EKS deployment, to best fit the cloud networking needs of your company, you can select the appropriate networking cloud components supported by the WA Helm chart to be used for the server and console components:
You can also leverage the Grafana monitoring tool to display WA performance data and metrics related to the server and console application servers (WebSphere Application Server Liberty Base). Grafana needs to be installed manually on Amazon EKS to have access to Grafana dashboards. Metrics provide drill-down for the state, health, and performance of your WA deployment and infrastructure. In this blog you can discover how to:
Let’s start by taking a tour!!! Deploy WA components (Server, Agent, Console) in an Amazon EKS cluster, using one of the available network configurations In this example, we set up the following topology for the WA environment and we configure the use of the ingress network configuration for the server and console components:
Let’s demonstrate how you can roll out the deployment without worrying about thecomponent installation process. For more information about the complete procedure, see: https://github.com/WorkloadAutomation/hcl-workload-automation-chart OR https://github.com/WorkloadAutomation/ibm-workload-automation-chart/blob/master/README.md
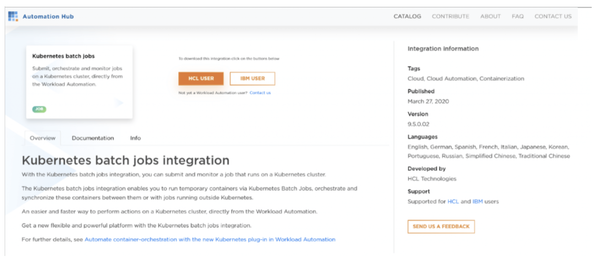
2. Add the Helm chart to the repo Add the Workload Automation chart to your repo and then pull it on your machine 3. Customize the Helm Chart values.yaml file Extract the package from the HCL or IBM Entitled Registry, as explained in the README fileand open the values.yaml Helm chart file. The values.yaml file contains the configurable parameters for the WA components. To deploy 2 Agents in the same instance, set the waagent replicaCount parameter to 2 Snap of replicaCount parameter from the values.yaml file Set the Console exposeServiceType as Ingress as follows: Snap of console Ingress configuration parameters from the values.yaml file Set the server exposeServiceType as Ingress as follows: Snap of server Ingress configuration parameters from the values.yaml file Save the changes in the values.yaml file and get ready to deploy the WA solution! 4. Deploy the WA environment configuration Now it’s time to deploy the configuration. From the directory where the values.yaml file is located, run: After about ten minutes, the WA environment is deployed and ready to use! No other configurations or settings are needed, you can start to get the best of the WA solution in the AWS EKS cluster! To work with the WA scheduling and monitoring functions, you can use the console as usual,or take advantage of the composer/conman command lines by accessing the WA master pod. To figure out how to get the WA console URL, continue to read this article! Workload Automation component pod view from the Kubernetes Manager tool Lens Install and configure the Automation Hub Kubernetes plug-in Let’s start to explore how to install and configure the native Kubernetes jobs on the AWS EKS environment. NOTE: These installation steps are also valid for any other Plug–in available in the AutomationHub catalog. To download the Kubernetes Batch Job Plug–in 9.5.0.02 version, go to the following Automation Hub URL: Workload Automation Kubernetes Batch Job plug–in in Automation Hub
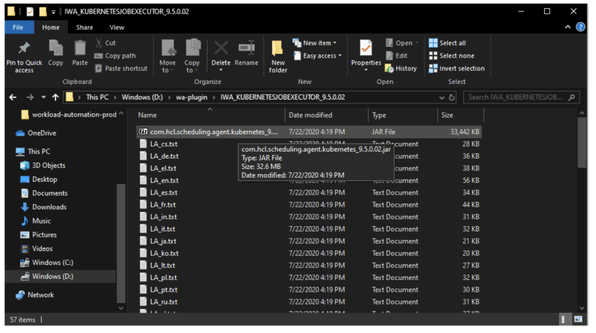
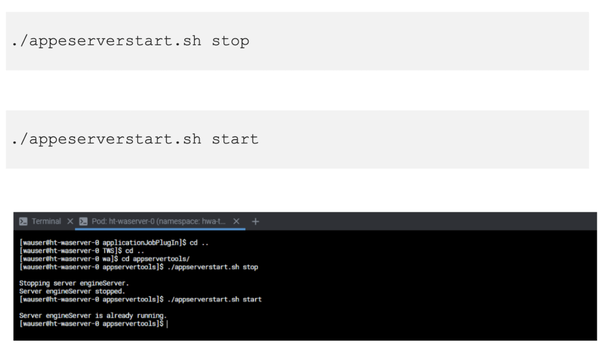
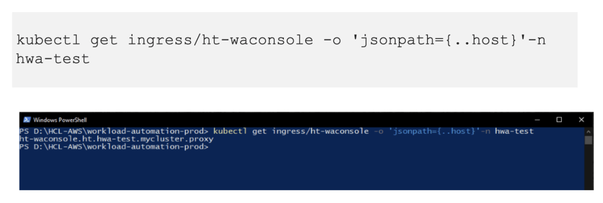
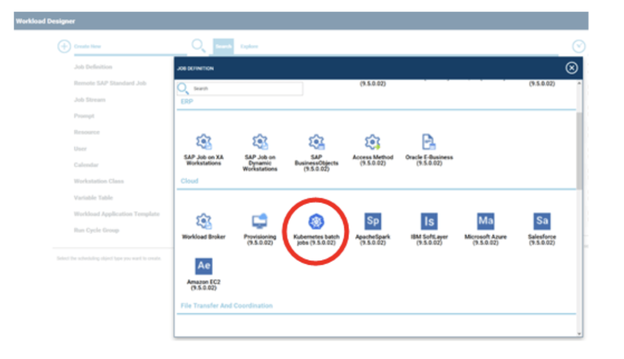
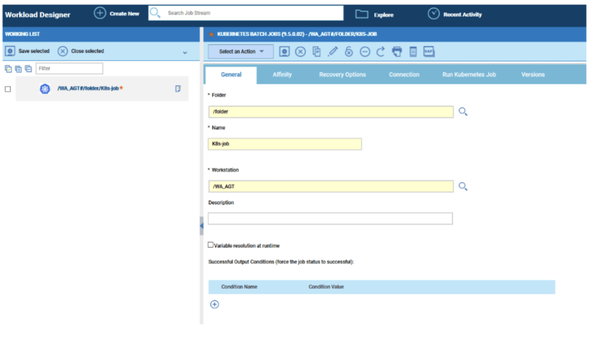
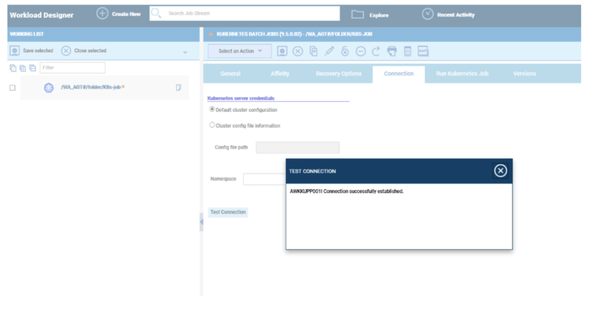
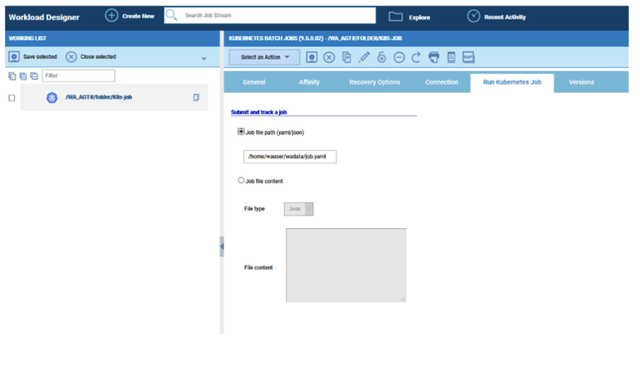
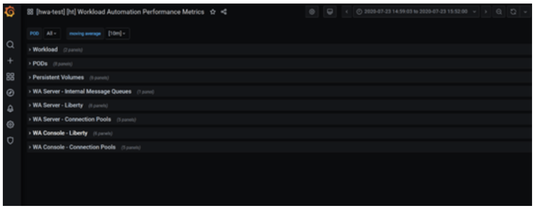
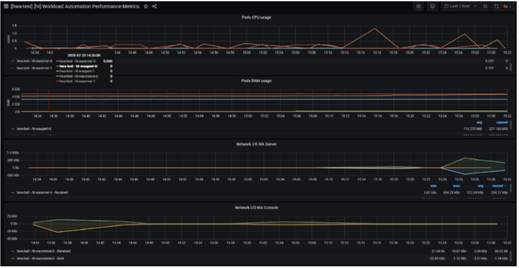
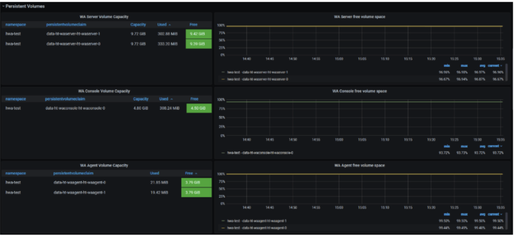
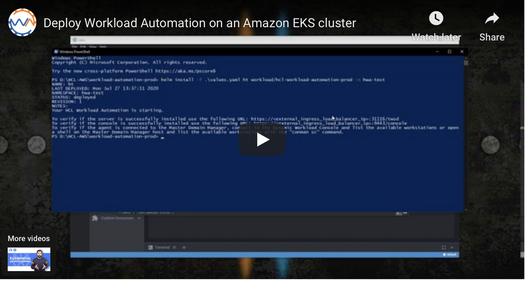
Download the package from Automation Hub and extract it to your machine 2. Copy the JAR file in the DATA_DIR folder of your WA master pod From the directory where you extracted the plug-in content, log in to your AWS EKS cluster, and run the command: 3. Copy the JAR file in the applicationJobPlugin folder Access the master pod and copy the Kubernetes JAR file from the /home/wauser/wadata/wa-plugin folder to the applicationJobPlugin folder. Copy command from the Server pod terminal 4. Restart the application server From the appservertools folder in TWS inst directory run the commands Workload Automation application server start/stop commands. Now the plug–in is installed, and you can start creating Kubernetes job definitions from the Dynamic Workload Console. 5. Create and submit the job To access the Dynamic Workload Console, you need the console ingress address. You can find it running the command: Kubernetes command to get the list of ingress addresses. Build up the URL of the console by copying the ingress address, as follows: From the Workload Designer create a new Kubernetes job definition: Job definition search page from the Dynamic Workload Console. Define the name of the job and workstation where the job runs: Job definition page of the Dynamic Workload Console. On the Connections page, check the connection to your cluster: Connection panel of the Kubernetes Batch Job plug–in in the Dynamic Workload Console. From the Run Kubernetes Job page, specify the name of the Kubernetes job yaml file that you have defined on your workstation. Kubernetes job configuration page of Workload Automation console Now there’s nothing left to do but save the job and submit it to run!!! As expected, the k8s job runs on a new pod deployed under the hwa-test namespace: Kubernetes Batch job pod view from Kubernetes Manager tool Lens. Once the job is done, the pod is automatically terminated. Monitor the WA environment through the customized Grafana Dashboard Now that your environment is running and you get how to install and use the plug–ins, you can monitor the health and performance of your WA environment. Use the metrics that WA has reserved for you!!! To get a list of all the amazing WA metrics available, see the Metric Monitoring section of the readme: https://github.com/WorkloadAutomation/hcl-workload-automation-chart Log in to the WA custom Grafana Dashboard, and access one of the following available custom metrics: List of Workload Automation custom metrics from the Grafana dashboard In each section, discover a brand-new way to monitor the health of your environment! Workload Automation custom metrics from the Grafana dashboard – Pod resources Take a look at the space available for your WA persistent volumes for WA DATA_DIR! Workload Automation custom metrics from the Grafana dashboard – Disk usage Full message queues are just an old memory! Workload Automation custom metrics from the Grafana dashboard – Message queue For an installation process example check this out! Author's Bio
0 Comments
Your comment will be posted after it is approved.
Leave a Reply. |
Archives
July 2024
Categories
All
|










 RSS Feed