 Keeping track of all the changes and workflows and be aware of unexpected behaviors can be challenging in complex Workload Automation environments, but don’t worry, we’ve got you covered! We are proud to announce you the new Era of Dashboards! Basing our work on customers feedbacks, requests and inputs collected thought the years and leveraging on the new Dynamic Workload Console 9.5 infrastructure, we designed and built a brand-new dashboard system which is:
We increased the customization options and decreased complexity! Creation of new dashboards from scratch has never been so easy, with possibility to include multiple type of data with even more filters than before, combining also integration between Workload Automation data and external sources of data, in order to have all the information you need in a single view, at a glance. Brand-new dashboard infrastructure built with state-of-the-art technology The Dynamic Workload Console has evolved with a new graphical layout, features and improved functionality. It has undergone both an architectural and web redesign. The interface is based on new architectural foundation of modern front-end technologies while maintaining current workload logic and processes. With this refurbishment, Dashboard Application Services Hub (DASH) is replaced by a lean, high-performance in-house solution that is now based on a lightweight, highly composable, fast to start, dynamic application server runtime environment, WebSphere Application Server Liberty. The user interface infrastructure is based on modern front-end technologies such as ReactJS, Redux, React-Saga, and SASS. The streamlined design of the console accommodates different features that improve the overall user experience: - a new live dashboard experience enables smart troubleshooting use cases for proactive incident management; - fully customizable and sharable dashboards to make real-time data-driven decisions and keep control of your entire business using the full set of information and data-sources of Workload Automation or data coming from RESTful services. Simplified customization & redesigned experience Maintaining and keeping control of a scheduling environment can be challenging. The right solution to monitor different machines and environments, is to have everything in one place; the Dynamic Workload Console with the new dashboarding system will serve you best! It has a completely renewed look and feel and usage experience to become nearer to your needs. Dynamic Workload Console provides two new completely redesigned default dashboards: - D Workload dashboard: data retrieval available are from distributed engines, showing information regarding jobs status, workstations status, critical jobs status and much more. - Z Workload dashboard: only z/OS engines listed. Data shown in widgets are related only to z/OS engines. 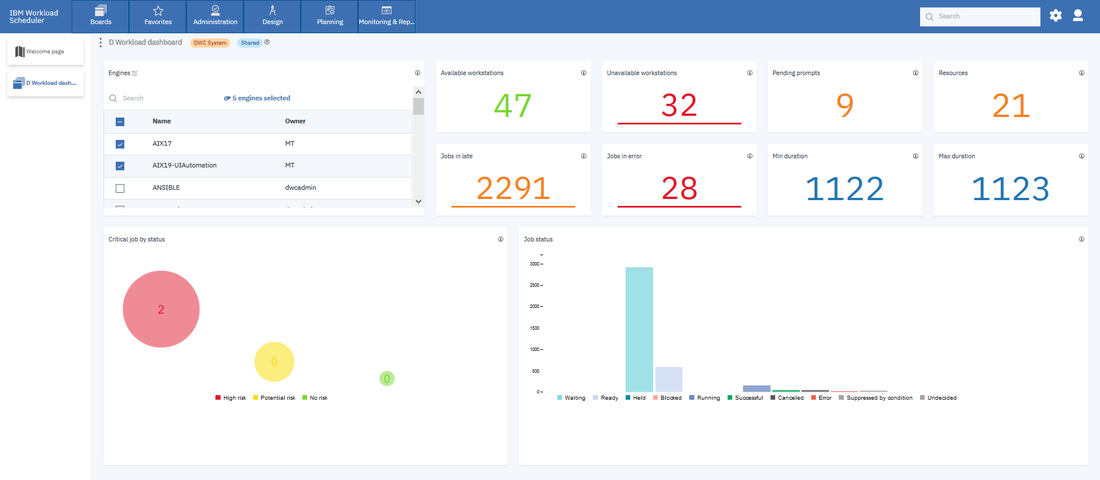 Engine selection No data is retrieved at Workload dashboard startup. The retrieval is based on the user selection through the engine list (single selection from GA to Fix Pack 1 version). Starting from the Fix pack 1, opening a board is possible to choose an engine and save the selection for the next access to the board. The multiple selection has been introduced in the last version. Now it is possible to retrieve data from multiple engines. In case of problems through the tooltip on the widget header you can get information about unavailable engines.  The drilldown functionality has been enabled automatically for all Plan Query datasources and the default REST API (Job count by status and Critical jobs) connected to KPI, Bar chart, Gauge, Pie chart and Bubble chart. It is triggered by clicking on the specific widget. In case of multiple engine selection, you can drilldown and monitor only Job and Jobstream (for any other object the single selection is required).  A duplicate action is available to allow customization of predefined dashboards. Switching to “Edit mode” you can modify widgets properties or resize and rearrange them freely within the custom board. The creation of widgets is also simplified and completely guided, selecting a datasource the type of widget is suggested. You can filter the data to show using the section tracked properties and set a threshold (KPI and Gauge). Once a widget is created you could also modify it and select another datasource from those suggested. Complete redesign of widgets A new Bar chart and Pie chart interaction has been added making possible to hide statuses on the fly. By clicking on the status legend, you can hide several statuses from charts and those are automatically resized based only on the data to be shown.  Furthermore, several types of widget have been made available: - Line chart, that allows to track a series of data and keep control of any changes - Bubble chart, represents data with a series of bubbles in descending order and size - Web content that allows you to wrap any web pages in your dashboard - Text Editor useful to have notes at your fingertips. New datasource system available New infrastructure allows users to create their own source of data, specifying any type of object and any type of filter. A set of predefined datasources, used by D Workload dashboard and Z Workload dashboard, is already available and can be duplicated and used as templates for creating new datasources. There are two types of datasource which can be used: Plan query and Rest API. Monitor Workload-like experience has been introduced in order to create easily a “Plan query” datasource with the same options from the monitoring. Furthermore, you can keep control of “external” data coming from RESTful services. From the Fix Pack 2 you can create Plan query datasources using all the filters if you select more than one engine on condition that they are homogeneous. 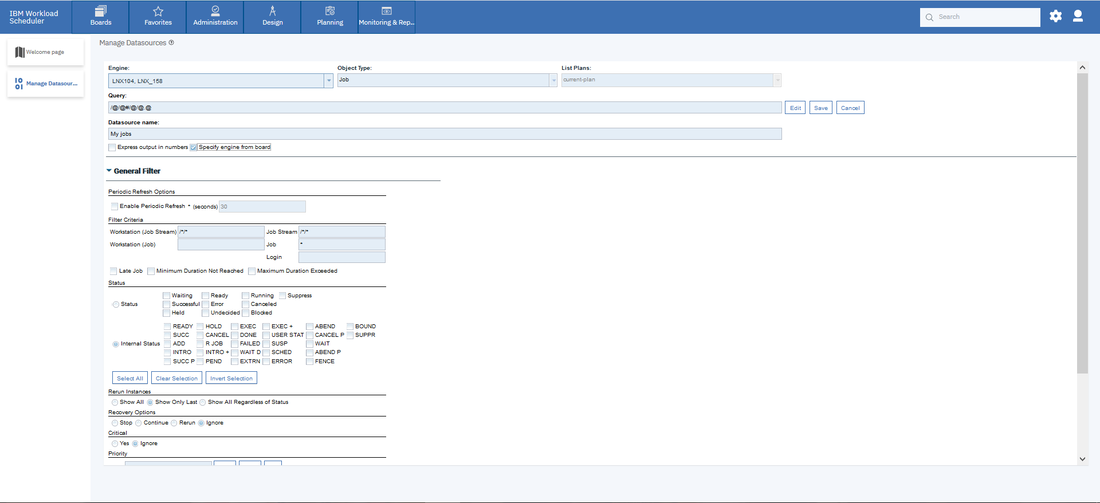 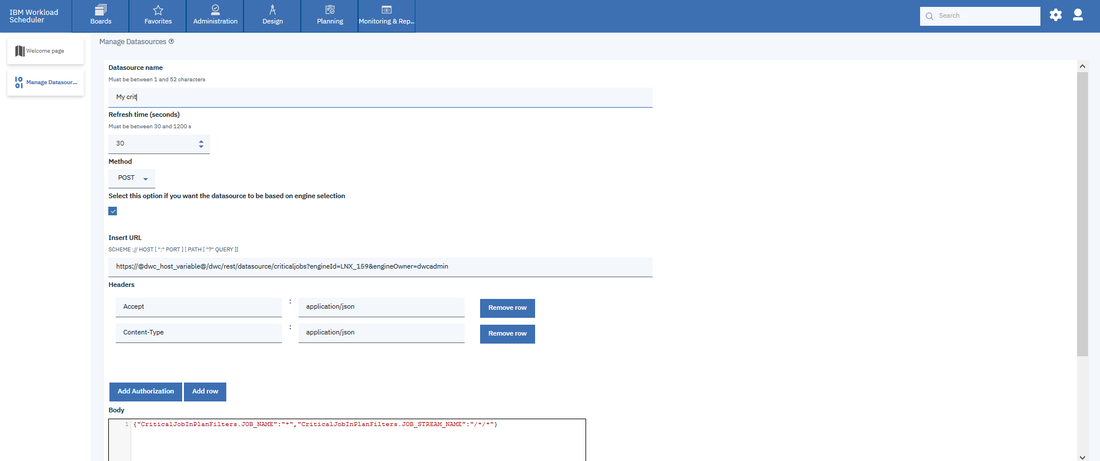 For an overview on the Workload Dashboard, have a look this video  Want to learn more or having questions about dashboards? Visit the Workload Automation website and don’t hesitate to contact us with an email at [email protected] and [email protected]! Author's BIO
0 Comments
Your comment will be posted after it is approved.
Leave a Reply. |
Archives
July 2024
Categories
All
|


 RSS Feed