 Workload Automation can really run anywhere. There is no limit to the number and type of platforms that are now supported. It doesn't matter what kind of environment you have, be it on Virtual Machine, Kubernetes, Docker container or Bare Metal the more complex the topology of your environment becomes the more useful it will be for you to be able to monitor your resources. Therefore, it is advisable that you have a tool that allows you to constantly monitor your environment in a centralized way, in terms of resources used, performance, activity status. Not to mention that in addition to being healthy, your environment must also make sure that your workflow continues to perform at its best if you want your business to be at the top. That's why you must constantly monitor all of this. And to do this in the best way, use a centralized approach, which allows you to obtain all the information you need to make your Workload Automation environment perform at its best. The tool that allows you to meet all these requirements is certainly Instana. With Instana you can take Workload Automation observability to the highest level. It allows you to monitor:
In this article you will find out how you can have all this, in a few simple steps, using Instana. Monitor Workload Automation Infrastructure First of all, if you want Instana to be able to monitor your infrastructure, you need to install an Instana Agent on each of your Virtual Machine, Kubernetes cluster or Server. The installation is extremely easy, all you have to do is to go, from the Instana Web Interface, in the section: “More” -> “Agents” And then click on “installing Instana Agent” at the top of the section. 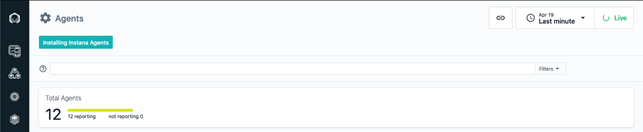 In this section you will have access to the commands needed to install Instana on all the supported platforms. In many cases, the installation commands are already preconfigured to ensure that the Instana agent is able to automatically connect to its Server. 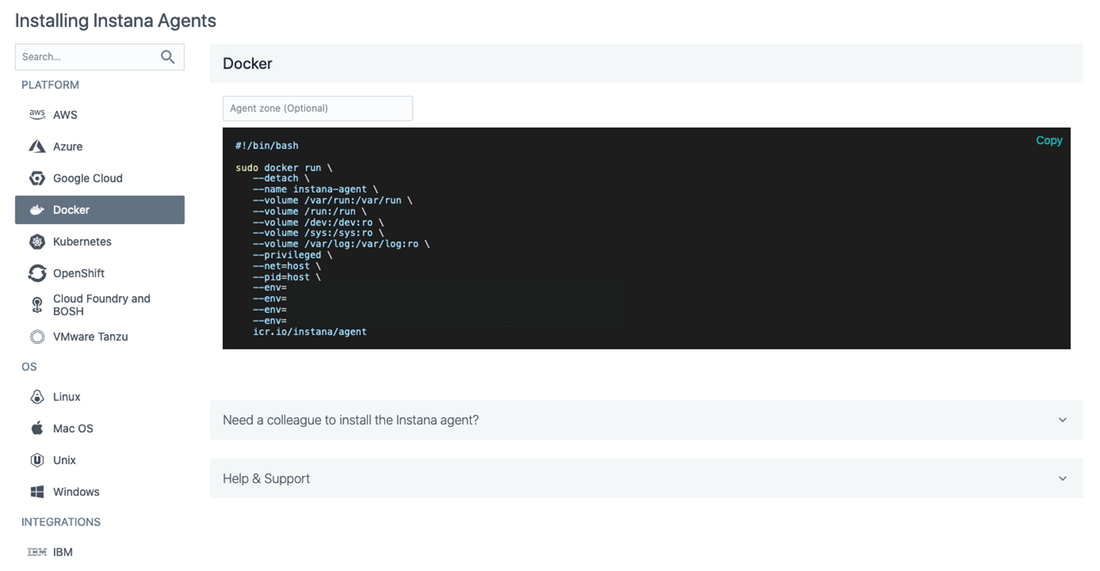 The platform available are really numerous, and if you don’t find the one that’s right for you, you can always contact the Support! Once the installation is complete, Instana Agent will automatically recognize the all the characteristics of the Host Machine, all the resources and all the applications that are currently running on the host. Whatever type of environment you have, Instana will be able to intercept and receognize the host machine. This way you can monitor your entire infrastructure, even if it contains different types of platforms. To monitor your infrastructure, just click on the “infrastructure” button from the sidebar of the Instana Web Interface. 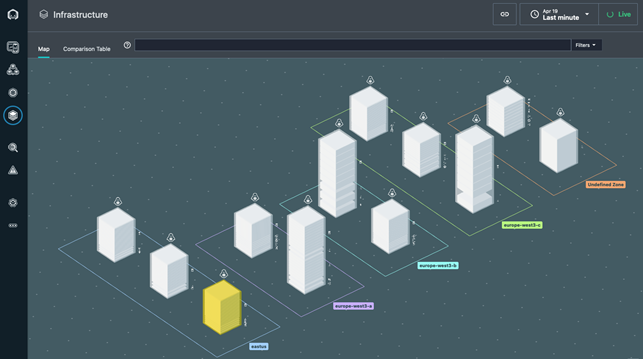 From this page you can monitor and check the status of the machines that make up your infrastructure. If a problem occurs on a particular machine, it will be marked in a different color. This way you can immediately identify where and what kind of problem has occurred in your environment. Monitor Web Applications With Instana you can also monitor you web applications. If you have a Dynamic Workload Console in your environment, this is a great news! To enable the monitoring of Web Applications just go and click on “Website and obile Apps” from the sidebar of the Instana Web Interface. 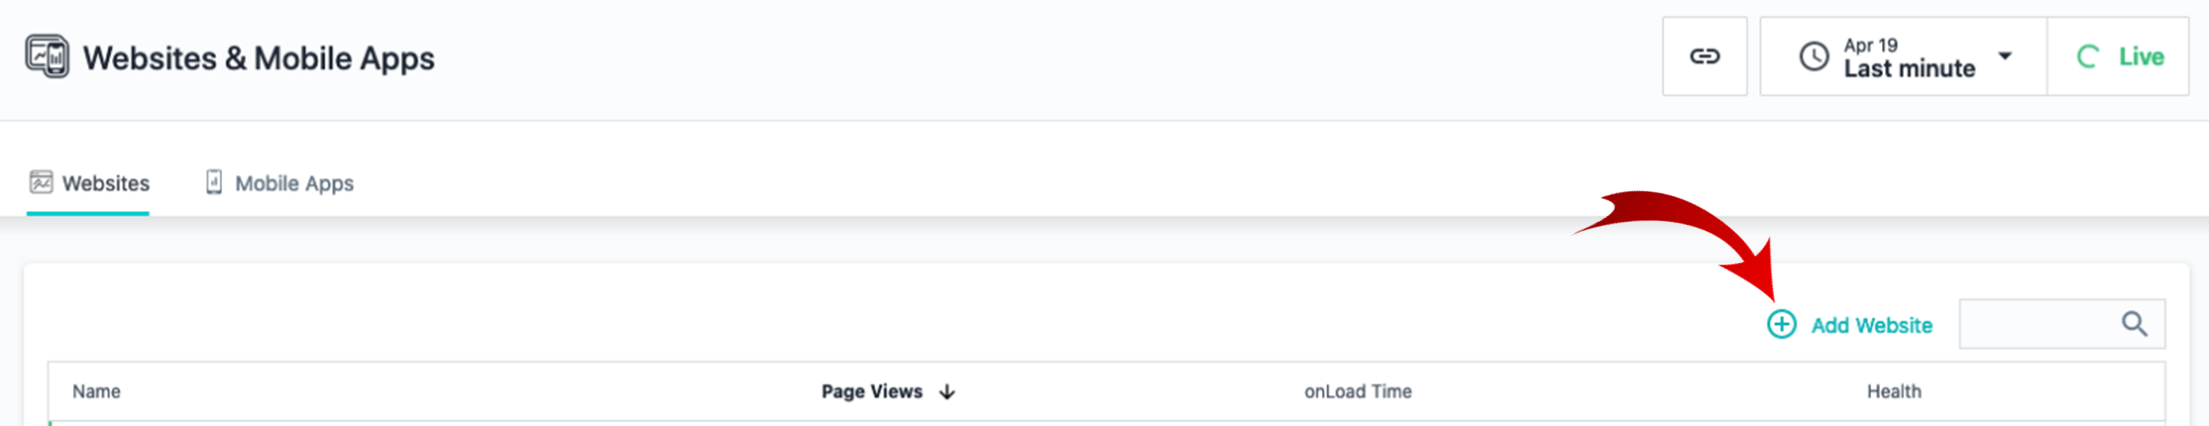 After giving a name to your Web Application, in the “Configuration” tab you will find a tracking script that you need to insert in the HTML <head /> of you web application. To enable the tracking of your Dynamic Workload Console you just need to paste the tracking script in the “index.jsp” file of your DWC. You can find the file at the following path. <dwc_inst_dir>/usr/servers/dwcServer/apps/DWC.ear/Console.war/dashboard 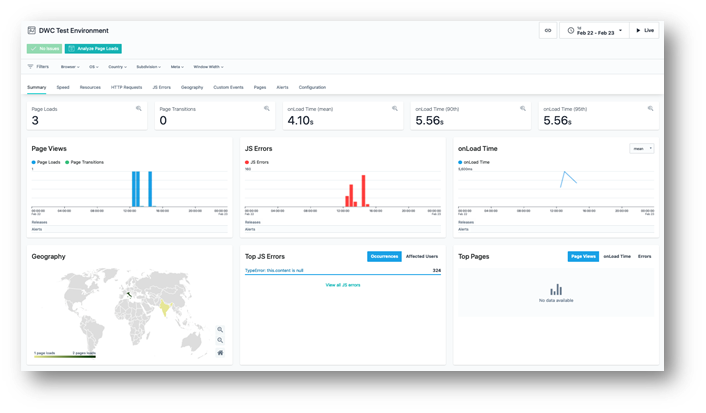 In this way, Instana will be able to track the number of logins and the location from which logins on your Dynamic Workload Console are performed. This can be very useful for monitoring and auditing accesses; you can check when an access was made and from which region. So, you will be able to immediately identify any unwanted access. Monitor Workload Automation Metrics Now that you have configured your Instana agents and associated your Dynamic Workload Console, you only need to let Instana to be able to also give you information about your Workflow. Workload Automation provides you information about all the Workload Automation ecosystem through a set of Metrics. The metrics are provided in the OpenMetrics standard, this means that all the tools that support this kind of standard can parse and manipulate them. The most common tool used suitable for this operation is certainly Prometheus. With Prometheus you can scrape the Workload Automation metrics and collect all the information that you need, for example, about:
Of course, all those information can be obtained and monitored using Instana! All you need to do is to enable the Instana Promethus integration, on the machine where your Workload Automation Server is installed. Modify the file “configuration.yaml” at the following path: <instana_inst_dir>/etc/instana/configuration.yaml And add the following lines: com.instana.plugin.prometheus: username: '' password: '' customMetricSources: - url: 'http://localhost:8080/metrics' username: ‘WAUSER' password: 'WAPASSWORD' Where WAUSER and WAPASSWORD are your Workload Automation Server credentials, or the credentials of a user that has access to the metrics as described here. In this way, Instana, thanks to the work of Prometheus can find all the Workload Automation metrics. To verify that you can now see the metrics, click on “Infrastructure” from the sidebar of the Instana Web Interface. Then select the machine on which you have configured the Prometheus integration and click on "Open Dashboard" 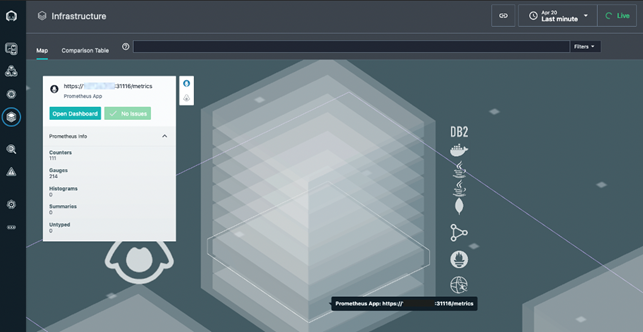 Now, you can browse all the Workload Automation Metrics, inspect their output and pin your favorite one. 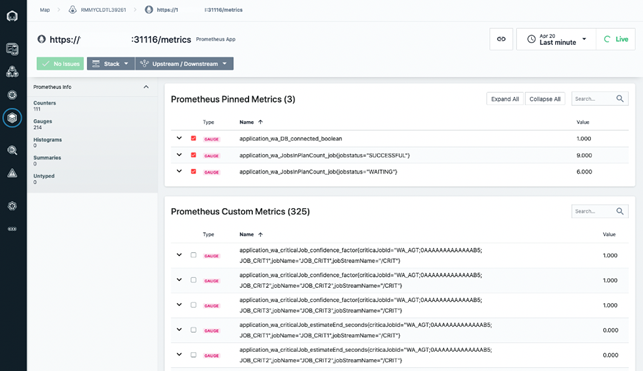 All the Workload Automation Metrics exposed can be used to build up a new Instana dashboard. In this case you can add all the information that you mostly need, for monitoring your Workload Automation Environment. To create an Instana dashboard that contains Workload Automation Metrics as datasource just click on Instana logo, from the Instana Web Interface, and then click on “Create Dashboard” 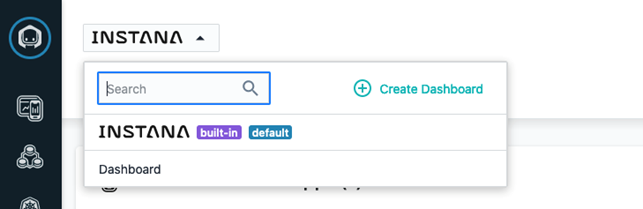 Now you can choose from a list of widgets by clicking on “Add Widget” from the top right corner of the page. Let’s choose “Time Chart”. Then from the “Data Source” dropdown list, select “Infrastructure and Platforms”. From the “Metrics” dropdown list, select Prometheus. From the Prometheus metrics type, we have access to all the Workload Automation Metrics. Let’s select the “application_wa_DB_connected_boolean” metric. You can search it from the list or simply paste the name of the metric in the search bar. 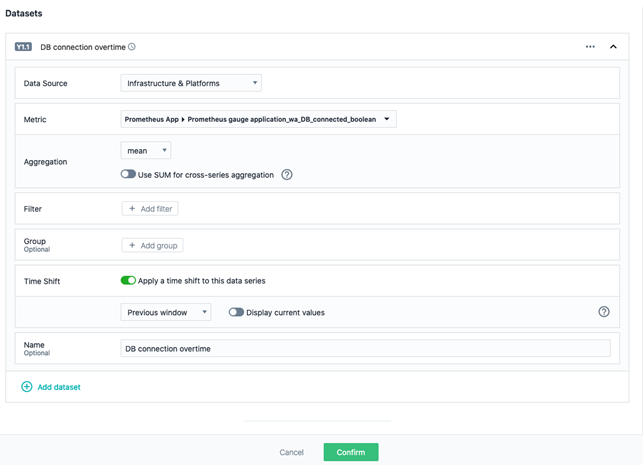 Once you have created your dataset, press on Confirm to create your first widget on your new dashboard. Repeat this operation to add all the widget that you need and save the changes. 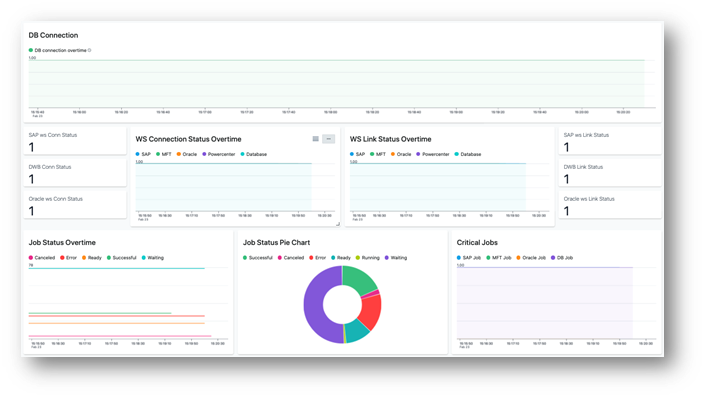 Now you have a new and cool Dashboard that can help you to monitor your Workload Automation Environment. In this way you can easily keep track of what happen in your workflow. You can have an overview of all the information that you need to keep you environment healthy and to control the status of your Jobs! Authors Bio
0 Comments
Your comment will be posted after it is approved.
Leave a Reply. |
Archives
July 2024
Categories
All
|


 RSS Feed